При
рассмотрении зависимости двух
СВ
говорят о парной
регрессии.
Зависимость нескольких переменных
(множественная
регрессия):
М(Y|x1,
x2,…, xm) = f(x1, x2, …, xm)

где
X = (X1, X2, …, Xm) − вектор независимых
(объясняющих) переменных; β − вектор
параметров (подлежащих определению); ε
− случайная ошибка (отклонение);
Y-зависимая (объясняемая) переменная.
Теоретическое
линейное уравнение регрессии (для
индивидуальных наблюдений)

число
степеней свободы:
ν
= n –m-1
m
— число параметров при переменных х (в
линейной регрессии совпадает с числом
включенных в модель факторов);
n
— число наблюдений.
Чем
оно меньше, тем ниже статистическая
надежность оцениваемой формулы. Для
надежности требуется, чтобы n
в минимум 3 раза превосходило m.
Предпосылки
МНК (см. вопр. 4)
Эмпирическое
уравнение регрессии:

Отклонение
еi
эмпирического значения yi от рассчитанного
с пом. МНК значения yi:

По
МНК:

Условие
минимума функции — равенство нулю всех
ее частных производных по bj. Частные
производные квадратичной функции
являются линейными функциями.
Система
нормальных уравнений МНК:

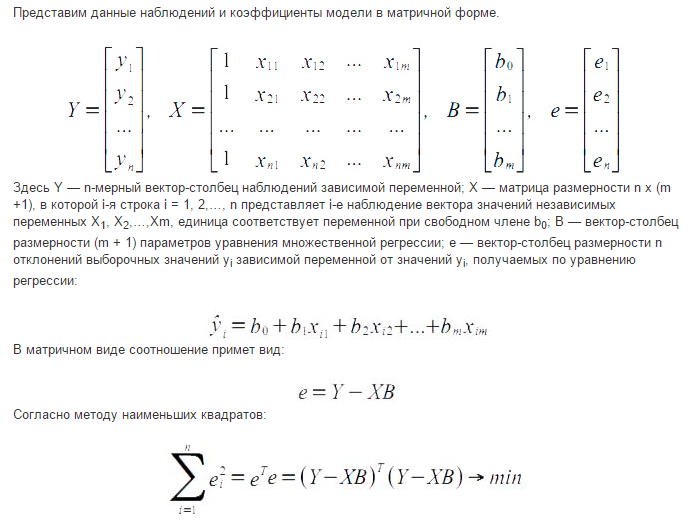
Матричная
форма:

Y
−
вектор-столбец размерности n наблюдений
зависимой переменной Y;
Х
−
матрица размерности n × (m + 1), в которой
i-я строка (i = 1, 2, … , n) представляет
наблюдение вектора значений независимых
переменных X1, X2, …, Xm; единица соответствует
переменной при свободном члене b0;
B
− вектор-столбец размерности (m+ 1)
параметров уравнения регрессии;
e
− вектор-столбец размерности n отклонений
выборочных (реальных) значений yi зависимой
переменной Y от значений yi
e
= Y − XB

7. Свойства мнк-оценок множественной линейной регрессии. Теорема Гаусса- Маркова.
Условия
Гаусса-Маркова (свойства МНК-оценок)

-
 –условие,
гарантирующее несмещённость оценок
МНК. -
 –условие
гомоскедастичности. -
 –условие
отсутствия автокорреляции предполагает
отсутствие систематической связи между
значениями случайного члена в любых
двух наблюдениях. -
 для
для
всех
 — условие независимости случайного
возмущения и объясняющей переменной.
Значение любой независимой переменной
в каждом наблюдении должно считаться
экзогенным, полностью определяемым
внешними причинами, не учитываемыми в
уравнении регрессии.
Теорема
Гаусса-Маркова:
если выполнены условия Гаусса-Маркова,
тогда оценки
 ,
,
полученные с помощью метода наименьших
квадратов, являются линейными,
несмещёнными, эффективными и состоятельными
оценками.
-
Линейность
оценок – оценки параметров
 и
и представляют собой линейные комбинации
наблюдаемых значений объясняемой
переменной .
. -
Несмещённость
оценок:


-
Состоятельность
оценок:

 Чем больше наблюдений, тем ближе
подсчитанные а и б к реальным. -
Эффективность
– означает, что оценка имеет минимальную
дисперсию в заданном классе оценок:

другое
Свойство
эффективности оценок неизвестных
параметров модели регрессии, полученных
методом наименьших квадратов, доказывается
с помощью теоремы Гаусса-Маркова.
Сделаем
следующие предположения о модели парной
регрессии:
1)
факторная переменная xi–
неслучайная или детерминированная
величина, которая не зависит от
распределения случайной ошибки модели
регрессии
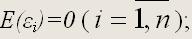
2)
математическое ожидание случайной
ошибки модели регрессии равно нулю во
всех наблюдениях:

3)
дисперсия случайной ошибки модели
регрессии постоянна для всех наблюдений:;

4)
между значениями случайных ошибок
модели регрессии в любых двух наблюдениях
отсутствует систематическая взаимосвязь,
т. е. случайные ошибки модели регрессии
не коррелированны между собой (ковариация
случайных ошибок любых двух разных
наблюдений равна нулю):

Это
условие выполняется в том случае, если
исходные данные не являются временными
рядами;
5)
на основании третьего и четвёртого
условий часто добавляется пятое условие,
заключающееся в том, что случайная
ошибка модели регрессии – это случайная
величина, подчиняющейся нормальному
закону распределения с нулевым
математическим ожиданием и дисперсией
G2:
Если
выдвинутые предположения справедливы,
то оценки неизвестных параметров модели
парной регрессии, полученные методом
наименьших квадратов, имеют наименьшую
дисперсию в классе всех линейных
несмещённых оценок, т. е. МНК-оценки
можно считать эффективными оценками
неизвестных параметров и .
Если
выдвинутые предположения справедливы
для модели множественной регрессии, то
оценки неизвестных параметров данной
модели регрессии, полученные методом
наименьших квадратов, имеют наименьшую
дисперсию в классе всех линейных
несмещённых оценок, т. е. МНК-оценки
можно считать эффективными оценками
неизвестных параметров.
Для
обозначения дисперсий МНК-оценок
неизвестных параметров модели регрессии
используется матрица ковариаций.
Матрицей
ковариаций МНК-оценок параметров
линейной модели парной регрессии
называется выражение вида:

где

– дисперсия
МНК-оценки параметра модели регрессии
;

– дисперсия
МНК-оценки параметра модели регрессии
.
Матрицей
ковариаций МНК-оценок параметров
линейной модели множественной регрессии
называется выражение вида:

где
G2()
– это дисперсия случайной ошибки модели
регрессии .
Для
линейной модели парной регрессии
дисперсии оценок неизвестных параметров
определяются по формулам:
1)

2)
дисперсия МНК-оценки коэффициента
модели регрессии :

где
G2()
– дисперсия случайной ошибки уравнения
регрессии ;
G2(x)
– дисперсия независимой переменой
модели регрессии х;
n
– объём выборочной совокупности.
В
связи с тем, что на практике значение
дисперсии случайной ошибки модели
регрессии G2()
неизвестно, для вычисления матрицы
ковариаций МНК-оценок применяют оценку
дисперсии случайной ошибки модели
регрессии S2().
Для
линейной модели парной регрессии оценка
дисперсии случайной ошибки определяется
по формуле:

где

– это
остатки регрессионной модели, которые
рассчитываются как

Тогда
оценка дисперсии МНК-оценки коэффициента
линейной модели парной регрессии будет
определяться по формуле:

Оценка
дисперсии МНК-оценки коэффициента
линейной модели парной регрессии будет
определяться по формуле:

Для
модели множественной регрессии общую
формулу расчёта матрицы ковариаций
МНК-оценок коэффициентов на основе
оценки дисперсии случайной ошибки
модели регрессии можно записать следующим
образом:

Соседние файлы в предмете [НЕСОРТИРОВАННОЕ]
- #
- #
- #
- #
- #
- #
- #
- #
- #
- #
- #
From Wikipedia, the free encyclopedia
The regression (or regressive) fallacy is an informal fallacy. It assumes that something has returned to normal because of corrective actions taken while it was abnormal. This fails to account for natural fluctuations. It is frequently a special kind of the post hoc fallacy.
Explanation[edit]
Things like golf scores and chronic back pain fluctuate naturally and usually regress toward the mean. The logical flaw is to make predictions that expect exceptional results to continue as if they were average (see Representativeness heuristic). People are most likely to take action when variance is at its peak. Then after results become more normal they believe that their action was the cause of the change when in fact it was not causal.
This use of the word «regression» was coined by Sir Francis Galton in a study from 1885 called «Regression Toward Mediocrity in Hereditary Stature». He showed that the height of children from very short or very tall parents would move toward the average. In fact, in any situation where two variables are less than perfectly correlated, an exceptional score on one variable may not be matched by an equally exceptional score on the other variable. The imperfect correlation between parents and children (height is not entirely heritable) means that the distribution of heights of their children will be centered somewhere between the average of the parents and the average of the population as whole. Thus, any single child can be more extreme than the parents, but the odds are against it.
Examples[edit]
When his pain got worse, he went to a doctor, after which the pain subsided a little. Therefore, he benefited from the doctor’s treatment.
The pain subsiding a little after it has gotten worse is more easily explained by regression toward the mean. Assuming the pain relief was caused by the doctor is fallacious.
The student did exceptionally poorly last semester, so I punished him. He did much better this semester. Clearly, punishment is effective in improving students’ grades.
Often exceptional performances are followed by more normal performances, so the change in performance might better be explained by regression toward the mean. Incidentally, some experiments have shown that people may develop a systematic bias for punishment and against reward because of reasoning analogous to this example of the regression fallacy.[1]
The frequency of accidents on a road fell after a speed camera was installed. Therefore, the speed camera has improved road safety.
Speed cameras are often installed after a road incurs an exceptionally high number of accidents, and this value usually falls (regression to mean) immediately afterward. Many speed camera proponents attribute this fall in accidents to the speed camera, without observing the overall trend.
Some authors use the Sports Illustrated cover jinx as an example of a regression effect: extremely good performances are likely to be followed by less extreme ones, and athletes are chosen to appear on the cover of Sports Illustrated only after extreme performances. Attributing this to a «jinx» rather than regression, as some athletes reportedly believe, is an example of committing the regression fallacy.[2]
Misapplication[edit]
On the other hand, dismissing valid explanations can lead to a worse situation. For example:
After the Western Allies invaded Normandy, creating a second major front, German control of Europe waned. Clearly, the combination of the Western Allies and the USSR drove the Germans back.
Fallacious evaluation: «Given that the counterattacks against Germany occurred only after they had conquered the greatest amount of territory under their control, regression toward the mean can explain the retreat of German forces from occupied territories as a purely random fluctuation that would have happened without any intervention on the part of the USSR or the Western Allies.» However, this was not the case. The reason is that political power and occupation of territories is not primarily determined by random events, making the concept of regression toward the mean inapplicable (on the large scale).
In essence, misapplication of regression toward the mean can reduce all events to a just-so story, without cause or effect. (Such misapplication takes as a premise that all events are random, as they must be for the concept of regression toward the mean to be validly applied.)
Notes[edit]
- ^ Schaffner, 1985; Gilovich, 1991 pp. 27–28
- ^ Gilovich, 1991 pp. 26–27; Plous, 1993 p. 118
References[edit]
- Friedman, Milton (1992). «Do Old Fallacies Ever Die?». Journal of Economic Literature. 30 (4): 2129–2132. JSTOR 2727976.
- Gilovich, Thomas (1991). How we know what isn’t so: The fallibility of human reason in everyday life. New York: The Free Press. ISBN 0029117054.
- Plous, Scott (1993). The Psychology of Judgment and Decision making. New York: McGraw-Hill. ISBN 0070504776.
- Quah, Danny (1993). «Galton’s Fallacy and Tests of the Convergence Hypothesis». The Scandinavian Journal of Economics. 95 (4): 427–433. doi:10.2307/3440905. hdl:1721.1/63653. JSTOR 3440905.
- Schaffner, P.E. (1985). «Specious learning about reward and punishment». Journal of Personality and Social Psychology. 48 (6): 1377–86. doi:10.1037/0022-3514.48.6.1377.
External links[edit]
- Fallacy files: Regression fallacy
From Wikipedia, the free encyclopedia
The regression (or regressive) fallacy is an informal fallacy. It assumes that something has returned to normal because of corrective actions taken while it was abnormal. This fails to account for natural fluctuations. It is frequently a special kind of the post hoc fallacy.
Explanation[edit]
Things like golf scores and chronic back pain fluctuate naturally and usually regress toward the mean. The logical flaw is to make predictions that expect exceptional results to continue as if they were average (see Representativeness heuristic). People are most likely to take action when variance is at its peak. Then after results become more normal they believe that their action was the cause of the change when in fact it was not causal.
This use of the word «regression» was coined by Sir Francis Galton in a study from 1885 called «Regression Toward Mediocrity in Hereditary Stature». He showed that the height of children from very short or very tall parents would move toward the average. In fact, in any situation where two variables are less than perfectly correlated, an exceptional score on one variable may not be matched by an equally exceptional score on the other variable. The imperfect correlation between parents and children (height is not entirely heritable) means that the distribution of heights of their children will be centered somewhere between the average of the parents and the average of the population as whole. Thus, any single child can be more extreme than the parents, but the odds are against it.
Examples[edit]
When his pain got worse, he went to a doctor, after which the pain subsided a little. Therefore, he benefited from the doctor’s treatment.
The pain subsiding a little after it has gotten worse is more easily explained by regression toward the mean. Assuming the pain relief was caused by the doctor is fallacious.
The student did exceptionally poorly last semester, so I punished him. He did much better this semester. Clearly, punishment is effective in improving students’ grades.
Often exceptional performances are followed by more normal performances, so the change in performance might better be explained by regression toward the mean. Incidentally, some experiments have shown that people may develop a systematic bias for punishment and against reward because of reasoning analogous to this example of the regression fallacy.[1]
The frequency of accidents on a road fell after a speed camera was installed. Therefore, the speed camera has improved road safety.
Speed cameras are often installed after a road incurs an exceptionally high number of accidents, and this value usually falls (regression to mean) immediately afterward. Many speed camera proponents attribute this fall in accidents to the speed camera, without observing the overall trend.
Some authors use the Sports Illustrated cover jinx as an example of a regression effect: extremely good performances are likely to be followed by less extreme ones, and athletes are chosen to appear on the cover of Sports Illustrated only after extreme performances. Attributing this to a «jinx» rather than regression, as some athletes reportedly believe, is an example of committing the regression fallacy.[2]
Misapplication[edit]
On the other hand, dismissing valid explanations can lead to a worse situation. For example:
After the Western Allies invaded Normandy, creating a second major front, German control of Europe waned. Clearly, the combination of the Western Allies and the USSR drove the Germans back.
Fallacious evaluation: «Given that the counterattacks against Germany occurred only after they had conquered the greatest amount of territory under their control, regression toward the mean can explain the retreat of German forces from occupied territories as a purely random fluctuation that would have happened without any intervention on the part of the USSR or the Western Allies.» However, this was not the case. The reason is that political power and occupation of territories is not primarily determined by random events, making the concept of regression toward the mean inapplicable (on the large scale).
In essence, misapplication of regression toward the mean can reduce all events to a just-so story, without cause or effect. (Such misapplication takes as a premise that all events are random, as they must be for the concept of regression toward the mean to be validly applied.)
Notes[edit]
- ^ Schaffner, 1985; Gilovich, 1991 pp. 27–28
- ^ Gilovich, 1991 pp. 26–27; Plous, 1993 p. 118
References[edit]
- Friedman, Milton (1992). «Do Old Fallacies Ever Die?». Journal of Economic Literature. 30 (4): 2129–2132. JSTOR 2727976.
- Gilovich, Thomas (1991). How we know what isn’t so: The fallibility of human reason in everyday life. New York: The Free Press. ISBN 0029117054.
- Plous, Scott (1993). The Psychology of Judgment and Decision making. New York: McGraw-Hill. ISBN 0070504776.
- Quah, Danny (1993). «Galton’s Fallacy and Tests of the Convergence Hypothesis». The Scandinavian Journal of Economics. 95 (4): 427–433. doi:10.2307/3440905. hdl:1721.1/63653. JSTOR 3440905.
- Schaffner, P.E. (1985). «Specious learning about reward and punishment». Journal of Personality and Social Psychology. 48 (6): 1377–86. doi:10.1037/0022-3514.48.6.1377.
External links[edit]
- Fallacy files: Regression fallacy