Расхождение между расчетным
и действительным значениями изучаемых
величин называется ошибкой
наблюдения.
В зависимости от причин
возникновения различают:
-
ошибки
регистрации; -
ошибки
репрезентативности.
Ошибка регистрации —
это отклонения между значением показателя,
полученного в ходе статистического
наблюдения, и фактическим, действительным
его значением. Этот вид ошибок может
быть и при сплошном, и при несплошном
наблюдении.
Ошибки регистрации бывают:
случайные
и систематические.
Случайные ошибки —
это результат действия различных
факторов (например,
цифры переставлены местами, перепутаны
графы при заполнении формуляра и т. п.).
Систематические
ошибки регистрации
всегда имеют одинаковую тенденцию
либо к увеличению, либо к уменьшению
значения показателей по каждой единице
совокупности. Примером
может служить округление возраста
населения при проведении социологических
опросов населения. Многие опрашиваемые,
например, вместо 48-49 и 51-52 лет
говорят, что им 50.
Систематические ошибки
характерны только для не сплошного
наблюдения. Причина их возникновения
состоит в том, что отобранная и
обследованная совокупность недостаточно
точно воспроизводит (репрезентирует)
всю исходную совокупность в целом.
Отклонение значения
показателя обследованной совокупности
от его величины по исходной совокупности
называется ошибкой
репрезентативности.
Они также бывают случайные
и систематические.
Случайные ошибки возникают,
если отобранная совокупность неполно
воспроизводит всю совокупность в
целом.
Систематические ошибки
репрезентативности появляются
вследствие нарушения принципов
отбора единиц из исходной совокупности,
которые должны быть подвергнуты
наблюдению.
Чтобы избежать ошибок
необходимо:
-
обеспечить
качественное обучение персонала,
который буде проводить наблюдение; -
организовать
специальные частичные или сплошные
контрольные проверки правильности
заполнения стат. формуляров; -
провести
логический и арифметический контроль
полученных данных после окончания
сбора информации.
Арифметический
контроль основывается
на использовании количественных связей
между значениями различных показателей.
Логический контроль основывается
на знании взаимосвязей между логическими
показателями. Например,
человек в возрасте 6 лет
не может иметь высшего образования.
Обычно для исправления
ошибок, выявленных в ходе логического
контроля, требуется повторно обратиться
к источнику сведений.
4 Вопрос: Сводка и группировка данных.
Статистическая
сводка — комплекс
последовательных операций по первичной
обработке данных с целью выявления
типичных черт и закономерностей, присущих
изучаемому явлению. Это научно-организованная
обработка материалов наблюдения,
включающая подсчет групповых и общих
итогов, систематизацию, группировку
данных и составление таблиц.
Различают простую и сложную
сводку:
-
При
простой сводке производится подсчет
общих итогов по изучаемой совокупности. -
При
сложной сводке производится группировка
единиц наблюдения, подсчет итогов по
каждой группе и по всей совокупности,
и представление результатов группировки
в виде статистических таблиц.
Сводка состоит из следующих
этапов:
-
Выбор
группировочного признака; -
Определение
порядка формирования групп; -
Разработка
системы статистических показателей
для характеристики отдельных групп и
совокупности в целом; -
Разработка
макетов статистических таблиц для
представления результатов сводки.
Группировка —
это метод, при котором вся исследуемая
совокупность разделяется на группы по
какому-то существенному признаку.
Например, группировка предприятий по
формам собственности или группировка
населения по размеру среднедушевого
дохода.
Выбор группировочного
признака зависит от цели данной
группировки и предварительного
экономического анализа явления.
В зависимости от
степени сложности массового явления и
задач анализа —
группировки могут производится по
одному или нескольким признакам:
-
Если
производится группировка только по
одному признаку, то она называется простой. -
Если
по двум и более признакам, то такая
группировка называется сложной
или комбинационной.
В зависимости от решаемых
задач различают типологические,
структурные и аналитические группировки:
Типологическая группировка
— представляет собой разделение
исследуемой совокупности на однородные
группы. (группировка предприятий по
формам собственности)
Структурная группировка
— группировка, в которой происходит
разделение однородной совокупности на
группы, характеризующие ее структуру
по какому-то варьирующему признаку.
(группировка населения по уровню дохода).
Анализ статистических данных структурных
группировок, взятых за ряд периодов
показывает изменение структуры изучаемых
явлений, то есть структурные сдвиги.
Аналитическая
(факторная) группировка
— позволяет выявить взаимосвязи между
изучаемыми явлениями и их признаками.
(группировка банков по сумме уставного
капитала, величине активов и балансовой
прибыли)
Соседние файлы в предмете [НЕСОРТИРОВАННОЕ]
- #
- #
- #
- #
- #
- #
- #
- #
- #
- #
- #
2.4. Точность статистического наблюдения
Под точностью статистического наблюдения понимают степень соответствия значения наблюдаемого показателя, вычисленного по материалам обследования, его действительной величине. Расхождение, или разница, между ними называется ошибкой статистического наблюдения.
Различают две группы ошибок:
- ошибки регистрации;
- ошибки репрезентативности.
Ошибки регистрации присущи любому статистическому наблюдению, как сплошному, так и несплошному. Они делятся на случайные ошибки регистрации и систематические ошибки регистрации.
Случайными ошибками регистрации называют ошибки, возникающие вследствие действия случайных факторов. К ним можно отнести различного рода непреднамеренные описки: например, вместо возраста человека «15 лет» указано «5 лет», у Ивановой Марии Петровны в графе пол отмечен «Мужской» и т. п. Такие ошибки легко выявляются методом логического анализа, например, если человеку 8 лет, но имеется высшее образование, а в графе «Семейное положение» указано «Состоит в браке», то, естественно, следует исправить возраст. Если объем исследуемой совокупности велик или велика доля отбора при выборочном наблюдении, случайные ошибки регистрации имеют тенденцию взаимопогашаться вследствие действия закона больших чисел, поскольку ошибки, как правило, разнонаправлены и искажают статистический показатель как в большую, так и в меньшую сторону. При небольшом объеме наблюдения требуется тщательная выверка его результатов — логический анализ данных.
Систематические ошибки регистрации чаще всего имеют однонаправленные искажения: они либо увеличивают, либо уменьшают статистический показатель, и, что характерно, подобная ситуация повторяется от обследования к обследованию. Так, по результатам переписей (практически всех!) число замужних женщин превышает число женатых мужчин — мужчинам приятнее ощущать себя неженатыми, а для женщины как бы «стыдно» быть не замужем. Другой пример, когда человек округляет свой возраст — вместо 32 лет говорит 30, вместо 79-80 и т. п. (это явление широко известно и даже получило свое название — «аккумуляция возрастов»). Систематические ошибки регистрации могут возникать и из-за неточностей измерительных приборов, если сбор информации проводят путем непосредственного наблюдения.
Ошибки репрезентативности присущи только несплошному обследованию. Они также делятся на случайные и систематические ошибки.
Случайные ошибки репрезентативности возникают из-за того, что обследованию подвергается не вся совокупность в целом, а только ее часть, и, следовательно, при несплошном наблюдении они присутствуют всегда. В теории статистики разработаны специальные методы для оценки величин таких ошибок, на их основе для наблюдаемых показателей строят доверительные интервалы, т.д. эти ошибки вычисляются и находятся как бы «под контролем».
Хуже обстоит дело, если наряду со случайными ошибками имеются и ошибки систематические.
Систематические ошибки репрезентативности возникают, если при несплошном наблюдении кардинально нарушаются технологии отбора единиц из генеральной совокупности объектов, но чаще — если в ходе обследования не удается получить информацию обо всех отобранных для наблюдения единицах, например, вследствие отказа отвечать на вопросы анкеты, или если человека не удалось застать дома и т. п.
Ошибки статистического наблюдения для наглядности можно изобразить в виде схемы (рис. 2.1).
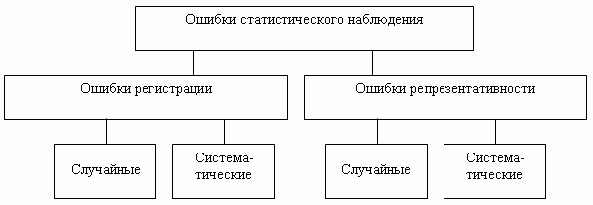
Рис.
2.1.
Виды ошибок статистического наблюдения
Для повышения точности наблюдения необходимо:
- правильно разработать формуляр статистического наблюдения: вопросы должны быть четкими, однозначными, не допускающими двойного толкования;
- иметь хорошо обученный персонал для проведения обследования;
- строго придерживаться выбранной технологии обследования (если проводится несплошное наблюдение) и помнить, что если не удается опросить какую-то конкретную единицу, отобранную для наблюдения, замена ее на другую единицу может привести к возникновению систематической ошибки репрезентативности;
- провести логический анализ данных, основанный на логических взаимосвязях показателей, после сбора всей совокупности анкет или формуляров;
- целесообразно провести и арифметический контроль данных, т.д. заново пересчитать расчетные величины, если какие-либо показатели получаются в результате определенных арифметических действий;
- предпринять определенные меры по восстановлению данных при наличии незаполненных анкет или формуляров либо при получении результатов обследования сделать поправку на неответы респондентов.
From Wikipedia, the free encyclopedia
«Systematic bias» redirects here. For the sociological and organizational phenomenon, see Systemic bias.
Observational error (or measurement error) is the difference between a measured value of a quantity and its true value.[1] In statistics, an error is not necessarily a «mistake». Variability is an inherent part of the results of measurements and of the measurement process.
Measurement errors can be divided into two components: random and systematic.[2]
Random errors are errors in measurement that lead to measurable values being inconsistent when repeated measurements of a constant attribute or quantity are taken. Systematic errors are errors that are not determined by chance but are introduced by repeatable processes inherent to the system.[3] Systematic error may also refer to an error with a non-zero mean, the effect of which is not reduced when observations are averaged.[citation needed]
Measurement errors can be summarized in terms of accuracy and precision.
Measurement error should not be confused with measurement uncertainty.
Science and experiments[edit]
When either randomness or uncertainty modeled by probability theory is attributed to such errors, they are «errors» in the sense in which that term is used in statistics; see errors and residuals in statistics.
Every time we repeat a measurement with a sensitive instrument, we obtain slightly different results. The common statistical model used is that the error has two additive parts:
- Systematic error which always occurs, with the same value, when we use the instrument in the same way and in the same case.
- Random error which may vary from observation to another.
Systematic error is sometimes called statistical bias. It may often be reduced with standardized procedures. Part of the learning process in the various sciences is learning how to use standard instruments and protocols so as to minimize systematic error.
Random error (or random variation) is due to factors that cannot or will not be controlled. One possible reason to forgo controlling for these random errors is that it may be too expensive to control them each time the experiment is conducted or the measurements are made. Other reasons may be that whatever we are trying to measure is changing in time (see dynamic models), or is fundamentally probabilistic (as is the case in quantum mechanics — see Measurement in quantum mechanics). Random error often occurs when instruments are pushed to the extremes of their operating limits. For example, it is common for digital balances to exhibit random error in their least significant digit. Three measurements of a single object might read something like 0.9111g, 0.9110g, and 0.9112g.
Characterization[edit]
Measurement errors can be divided into two components: random error and systematic error.[2]
Random error is always present in a measurement. It is caused by inherently unpredictable fluctuations in the readings of a measurement apparatus or in the experimenter’s interpretation of the instrumental reading. Random errors show up as different results for ostensibly the same repeated measurement. They can be estimated by comparing multiple measurements and reduced by averaging multiple measurements.
Systematic error is predictable and typically constant or proportional to the true value. If the cause of the systematic error can be identified, then it usually can be eliminated. Systematic errors are caused by imperfect calibration of measurement instruments or imperfect methods of observation, or interference of the environment with the measurement process, and always affect the results of an experiment in a predictable direction. Incorrect zeroing of an instrument leading to a zero error is an example of systematic error in instrumentation.
The Performance Test Standard PTC 19.1-2005 “Test Uncertainty”, published by the American Society of Mechanical Engineers (ASME), discusses systematic and random errors in considerable detail. In fact, it conceptualizes its basic uncertainty categories in these terms.
Random error can be caused by unpredictable fluctuations in the readings of a measurement apparatus, or in the experimenter’s interpretation of the instrumental reading; these fluctuations may be in part due to interference of the environment with the measurement process. The concept of random error is closely related to the concept of precision. The higher the precision of a measurement instrument, the smaller the variability (standard deviation) of the fluctuations in its readings.
Sources[edit]
Sources of systematic error[edit]
Imperfect calibration[edit]
Sources of systematic error may be imperfect calibration of measurement instruments (zero error), changes in the environment which interfere with the measurement process and sometimes imperfect methods of observation can be either zero error or percentage error. If you consider an experimenter taking a reading of the time period of a pendulum swinging past a fiducial marker: If their stop-watch or timer starts with 1 second on the clock then all of their results will be off by 1 second (zero error). If the experimenter repeats this experiment twenty times (starting at 1 second each time), then there will be a percentage error in the calculated average of their results; the final result will be slightly larger than the true period.
Distance measured by radar will be systematically overestimated if the slight slowing down of the waves in air is not accounted for. Incorrect zeroing of an instrument leading to a zero error is an example of systematic error in instrumentation.
Systematic errors may also be present in the result of an estimate based upon a mathematical model or physical law. For instance, the estimated oscillation frequency of a pendulum will be systematically in error if slight movement of the support is not accounted for.
Quantity[edit]
Systematic errors can be either constant, or related (e.g. proportional or a percentage) to the actual value of the measured quantity, or even to the value of a different quantity (the reading of a ruler can be affected by environmental temperature). When it is constant, it is simply due to incorrect zeroing of the instrument. When it is not constant, it can change its sign. For instance, if a thermometer is affected by a proportional systematic error equal to 2% of the actual temperature, and the actual temperature is 200°, 0°, or −100°, the measured temperature will be 204° (systematic error = +4°), 0° (null systematic error) or −102° (systematic error = −2°), respectively. Thus the temperature will be overestimated when it will be above zero and underestimated when it will be below zero.
Drift[edit]
Systematic errors which change during an experiment (drift) are easier to detect. Measurements indicate trends with time rather than varying randomly about a mean. Drift is evident if a measurement of a constant quantity is repeated several times and the measurements drift one way during the experiment. If the next measurement is higher than the previous measurement as may occur if an instrument becomes warmer during the experiment then the measured quantity is variable and it is possible to detect a drift by checking the zero reading during the experiment as well as at the start of the experiment (indeed, the zero reading is a measurement of a constant quantity). If the zero reading is consistently above or below zero, a systematic error is present. If this cannot be eliminated, potentially by resetting the instrument immediately before the experiment then it needs to be allowed by subtracting its (possibly time-varying) value from the readings, and by taking it into account while assessing the accuracy of the measurement.
If no pattern in a series of repeated measurements is evident, the presence of fixed systematic errors can only be found if the measurements are checked, either by measuring a known quantity or by comparing the readings with readings made using a different apparatus, known to be more accurate. For example, if you think of the timing of a pendulum using an accurate stopwatch several times you are given readings randomly distributed about the mean. Hopings systematic error is present if the stopwatch is checked against the ‘speaking clock’ of the telephone system and found to be running slow or fast. Clearly, the pendulum timings need to be corrected according to how fast or slow the stopwatch was found to be running.
Measuring instruments such as ammeters and voltmeters need to be checked periodically against known standards.
Systematic errors can also be detected by measuring already known quantities. For example, a spectrometer fitted with a diffraction grating may be checked by using it to measure the wavelength of the D-lines of the sodium electromagnetic spectrum which are at 600 nm and 589.6 nm. The measurements may be used to determine the number of lines per millimetre of the diffraction grating, which can then be used to measure the wavelength of any other spectral line.
Constant systematic errors are very difficult to deal with as their effects are only observable if they can be removed. Such errors cannot be removed by repeating measurements or averaging large numbers of results. A common method to remove systematic error is through calibration of the measurement instrument.
Sources of random error[edit]
The random or stochastic error in a measurement is the error that is random from one measurement to the next. Stochastic errors tend to be normally distributed when the stochastic error is the sum of many independent random errors because of the central limit theorem. Stochastic errors added to a regression equation account for the variation in Y that cannot be explained by the included Xs.
Surveys[edit]
The term «observational error» is also sometimes used to refer to response errors and some other types of non-sampling error.[1] In survey-type situations, these errors can be mistakes in the collection of data, including both the incorrect recording of a response and the correct recording of a respondent’s inaccurate response. These sources of non-sampling error are discussed in Salant and Dillman (1994) and Bland and Altman (1996).[4][5]
These errors can be random or systematic. Random errors are caused by unintended mistakes by respondents, interviewers and/or coders. Systematic error can occur if there is a systematic reaction of the respondents to the method used to formulate the survey question. Thus, the exact formulation of a survey question is crucial, since it affects the level of measurement error.[6] Different tools are available for the researchers to help them decide about this exact formulation of their questions, for instance estimating the quality of a question using MTMM experiments. This information about the quality can also be used in order to correct for measurement error.[7][8]
Effect on regression analysis[edit]
If the dependent variable in a regression is measured with error, regression analysis and associated hypothesis testing are unaffected, except that the R2 will be lower than it would be with perfect measurement.
However, if one or more independent variables is measured with error, then the regression coefficients and standard hypothesis tests are invalid.[9]: p. 187 This is known as attenuation bias.[10]
See also[edit]
- Bias (statistics)
- Cognitive bias
- Correction for measurement error (for Pearson correlations)
- Errors and residuals in statistics
- Error
- Replication (statistics)
- Statistical theory
- Metrology
- Regression dilution
- Test method
- Propagation of uncertainty
- Instrument error
- Measurement uncertainty
- Errors-in-variables models
- Systemic bias
References[edit]
- ^ a b Dodge, Y. (2003) The Oxford Dictionary of Statistical Terms, OUP. ISBN 978-0-19-920613-1
- ^ a b John Robert Taylor (1999). An Introduction to Error Analysis: The Study of Uncertainties in Physical Measurements. University Science Books. p. 94, §4.1. ISBN 978-0-935702-75-0.
- ^ «Systematic error». Merriam-webster.com. Retrieved 2016-09-10.
- ^ Salant, P.; Dillman, D. A. (1994). How to conduct your survey. New York: John Wiley & Sons. ISBN 0-471-01273-4.
- ^ Bland, J. Martin; Altman, Douglas G. (1996). «Statistics Notes: Measurement Error». BMJ. 313 (7059): 744. doi:10.1136/bmj.313.7059.744. PMC 2352101. PMID 8819450.
- ^ Saris, W. E.; Gallhofer, I. N. (2014). Design, Evaluation and Analysis of Questionnaires for Survey Research (Second ed.). Hoboken: Wiley. ISBN 978-1-118-63461-5.
- ^ DeCastellarnau, A. and Saris, W. E. (2014). A simple procedure to correct for measurement errors in survey research. European Social Survey Education Net (ESS EduNet). Available at: http://essedunet.nsd.uib.no/cms/topics/measurement Archived 2019-09-15 at the Wayback Machine
- ^ Saris, W. E.; Revilla, M. (2015). «Correction for measurement errors in survey research: necessary and possible» (PDF). Social Indicators Research. 127 (3): 1005–1020. doi:10.1007/s11205-015-1002-x. hdl:10230/28341. S2CID 146550566.
- ^ Hayashi, Fumio (2000). Econometrics. Princeton University Press. ISBN 978-0-691-01018-2.
- ^ Angrist, Joshua David; Pischke, Jörn-Steffen (2015). Mastering ‘metrics : the path from cause to effect. Princeton, New Jersey. p. 221. ISBN 978-0-691-15283-7. OCLC 877846199.
The bias generated by this sort of measurement error in regressors is called attenuation bias.
Further reading[edit]
- Cochran, W. G. (1968). «Errors of Measurement in Statistics». Technometrics. 10 (4): 637–666. doi:10.2307/1267450. JSTOR 1267450.
From Wikipedia, the free encyclopedia
«Systematic bias» redirects here. For the sociological and organizational phenomenon, see Systemic bias.
Observational error (or measurement error) is the difference between a measured value of a quantity and its true value.[1] In statistics, an error is not necessarily a «mistake». Variability is an inherent part of the results of measurements and of the measurement process.
Measurement errors can be divided into two components: random and systematic.[2]
Random errors are errors in measurement that lead to measurable values being inconsistent when repeated measurements of a constant attribute or quantity are taken. Systematic errors are errors that are not determined by chance but are introduced by repeatable processes inherent to the system.[3] Systematic error may also refer to an error with a non-zero mean, the effect of which is not reduced when observations are averaged.[citation needed]
Measurement errors can be summarized in terms of accuracy and precision.
Measurement error should not be confused with measurement uncertainty.
Science and experiments[edit]
When either randomness or uncertainty modeled by probability theory is attributed to such errors, they are «errors» in the sense in which that term is used in statistics; see errors and residuals in statistics.
Every time we repeat a measurement with a sensitive instrument, we obtain slightly different results. The common statistical model used is that the error has two additive parts:
- Systematic error which always occurs, with the same value, when we use the instrument in the same way and in the same case.
- Random error which may vary from observation to another.
Systematic error is sometimes called statistical bias. It may often be reduced with standardized procedures. Part of the learning process in the various sciences is learning how to use standard instruments and protocols so as to minimize systematic error.
Random error (or random variation) is due to factors that cannot or will not be controlled. One possible reason to forgo controlling for these random errors is that it may be too expensive to control them each time the experiment is conducted or the measurements are made. Other reasons may be that whatever we are trying to measure is changing in time (see dynamic models), or is fundamentally probabilistic (as is the case in quantum mechanics — see Measurement in quantum mechanics). Random error often occurs when instruments are pushed to the extremes of their operating limits. For example, it is common for digital balances to exhibit random error in their least significant digit. Three measurements of a single object might read something like 0.9111g, 0.9110g, and 0.9112g.
Characterization[edit]
Measurement errors can be divided into two components: random error and systematic error.[2]
Random error is always present in a measurement. It is caused by inherently unpredictable fluctuations in the readings of a measurement apparatus or in the experimenter’s interpretation of the instrumental reading. Random errors show up as different results for ostensibly the same repeated measurement. They can be estimated by comparing multiple measurements and reduced by averaging multiple measurements.
Systematic error is predictable and typically constant or proportional to the true value. If the cause of the systematic error can be identified, then it usually can be eliminated. Systematic errors are caused by imperfect calibration of measurement instruments or imperfect methods of observation, or interference of the environment with the measurement process, and always affect the results of an experiment in a predictable direction. Incorrect zeroing of an instrument leading to a zero error is an example of systematic error in instrumentation.
The Performance Test Standard PTC 19.1-2005 “Test Uncertainty”, published by the American Society of Mechanical Engineers (ASME), discusses systematic and random errors in considerable detail. In fact, it conceptualizes its basic uncertainty categories in these terms.
Random error can be caused by unpredictable fluctuations in the readings of a measurement apparatus, or in the experimenter’s interpretation of the instrumental reading; these fluctuations may be in part due to interference of the environment with the measurement process. The concept of random error is closely related to the concept of precision. The higher the precision of a measurement instrument, the smaller the variability (standard deviation) of the fluctuations in its readings.
Sources[edit]
Sources of systematic error[edit]
Imperfect calibration[edit]
Sources of systematic error may be imperfect calibration of measurement instruments (zero error), changes in the environment which interfere with the measurement process and sometimes imperfect methods of observation can be either zero error or percentage error. If you consider an experimenter taking a reading of the time period of a pendulum swinging past a fiducial marker: If their stop-watch or timer starts with 1 second on the clock then all of their results will be off by 1 second (zero error). If the experimenter repeats this experiment twenty times (starting at 1 second each time), then there will be a percentage error in the calculated average of their results; the final result will be slightly larger than the true period.
Distance measured by radar will be systematically overestimated if the slight slowing down of the waves in air is not accounted for. Incorrect zeroing of an instrument leading to a zero error is an example of systematic error in instrumentation.
Systematic errors may also be present in the result of an estimate based upon a mathematical model or physical law. For instance, the estimated oscillation frequency of a pendulum will be systematically in error if slight movement of the support is not accounted for.
Quantity[edit]
Systematic errors can be either constant, or related (e.g. proportional or a percentage) to the actual value of the measured quantity, or even to the value of a different quantity (the reading of a ruler can be affected by environmental temperature). When it is constant, it is simply due to incorrect zeroing of the instrument. When it is not constant, it can change its sign. For instance, if a thermometer is affected by a proportional systematic error equal to 2% of the actual temperature, and the actual temperature is 200°, 0°, or −100°, the measured temperature will be 204° (systematic error = +4°), 0° (null systematic error) or −102° (systematic error = −2°), respectively. Thus the temperature will be overestimated when it will be above zero and underestimated when it will be below zero.
Drift[edit]
Systematic errors which change during an experiment (drift) are easier to detect. Measurements indicate trends with time rather than varying randomly about a mean. Drift is evident if a measurement of a constant quantity is repeated several times and the measurements drift one way during the experiment. If the next measurement is higher than the previous measurement as may occur if an instrument becomes warmer during the experiment then the measured quantity is variable and it is possible to detect a drift by checking the zero reading during the experiment as well as at the start of the experiment (indeed, the zero reading is a measurement of a constant quantity). If the zero reading is consistently above or below zero, a systematic error is present. If this cannot be eliminated, potentially by resetting the instrument immediately before the experiment then it needs to be allowed by subtracting its (possibly time-varying) value from the readings, and by taking it into account while assessing the accuracy of the measurement.
If no pattern in a series of repeated measurements is evident, the presence of fixed systematic errors can only be found if the measurements are checked, either by measuring a known quantity or by comparing the readings with readings made using a different apparatus, known to be more accurate. For example, if you think of the timing of a pendulum using an accurate stopwatch several times you are given readings randomly distributed about the mean. Hopings systematic error is present if the stopwatch is checked against the ‘speaking clock’ of the telephone system and found to be running slow or fast. Clearly, the pendulum timings need to be corrected according to how fast or slow the stopwatch was found to be running.
Measuring instruments such as ammeters and voltmeters need to be checked periodically against known standards.
Systematic errors can also be detected by measuring already known quantities. For example, a spectrometer fitted with a diffraction grating may be checked by using it to measure the wavelength of the D-lines of the sodium electromagnetic spectrum which are at 600 nm and 589.6 nm. The measurements may be used to determine the number of lines per millimetre of the diffraction grating, which can then be used to measure the wavelength of any other spectral line.
Constant systematic errors are very difficult to deal with as their effects are only observable if they can be removed. Such errors cannot be removed by repeating measurements or averaging large numbers of results. A common method to remove systematic error is through calibration of the measurement instrument.
Sources of random error[edit]
The random or stochastic error in a measurement is the error that is random from one measurement to the next. Stochastic errors tend to be normally distributed when the stochastic error is the sum of many independent random errors because of the central limit theorem. Stochastic errors added to a regression equation account for the variation in Y that cannot be explained by the included Xs.
Surveys[edit]
The term «observational error» is also sometimes used to refer to response errors and some other types of non-sampling error.[1] In survey-type situations, these errors can be mistakes in the collection of data, including both the incorrect recording of a response and the correct recording of a respondent’s inaccurate response. These sources of non-sampling error are discussed in Salant and Dillman (1994) and Bland and Altman (1996).[4][5]
These errors can be random or systematic. Random errors are caused by unintended mistakes by respondents, interviewers and/or coders. Systematic error can occur if there is a systematic reaction of the respondents to the method used to formulate the survey question. Thus, the exact formulation of a survey question is crucial, since it affects the level of measurement error.[6] Different tools are available for the researchers to help them decide about this exact formulation of their questions, for instance estimating the quality of a question using MTMM experiments. This information about the quality can also be used in order to correct for measurement error.[7][8]
Effect on regression analysis[edit]
If the dependent variable in a regression is measured with error, regression analysis and associated hypothesis testing are unaffected, except that the R2 will be lower than it would be with perfect measurement.
However, if one or more independent variables is measured with error, then the regression coefficients and standard hypothesis tests are invalid.[9]: p. 187 This is known as attenuation bias.[10]
See also[edit]
- Bias (statistics)
- Cognitive bias
- Correction for measurement error (for Pearson correlations)
- Errors and residuals in statistics
- Error
- Replication (statistics)
- Statistical theory
- Metrology
- Regression dilution
- Test method
- Propagation of uncertainty
- Instrument error
- Measurement uncertainty
- Errors-in-variables models
- Systemic bias
References[edit]
- ^ a b Dodge, Y. (2003) The Oxford Dictionary of Statistical Terms, OUP. ISBN 978-0-19-920613-1
- ^ a b John Robert Taylor (1999). An Introduction to Error Analysis: The Study of Uncertainties in Physical Measurements. University Science Books. p. 94, §4.1. ISBN 978-0-935702-75-0.
- ^ «Systematic error». Merriam-webster.com. Retrieved 2016-09-10.
- ^ Salant, P.; Dillman, D. A. (1994). How to conduct your survey. New York: John Wiley & Sons. ISBN 0-471-01273-4.
- ^ Bland, J. Martin; Altman, Douglas G. (1996). «Statistics Notes: Measurement Error». BMJ. 313 (7059): 744. doi:10.1136/bmj.313.7059.744. PMC 2352101. PMID 8819450.
- ^ Saris, W. E.; Gallhofer, I. N. (2014). Design, Evaluation and Analysis of Questionnaires for Survey Research (Second ed.). Hoboken: Wiley. ISBN 978-1-118-63461-5.
- ^ DeCastellarnau, A. and Saris, W. E. (2014). A simple procedure to correct for measurement errors in survey research. European Social Survey Education Net (ESS EduNet). Available at: http://essedunet.nsd.uib.no/cms/topics/measurement Archived 2019-09-15 at the Wayback Machine
- ^ Saris, W. E.; Revilla, M. (2015). «Correction for measurement errors in survey research: necessary and possible» (PDF). Social Indicators Research. 127 (3): 1005–1020. doi:10.1007/s11205-015-1002-x. hdl:10230/28341. S2CID 146550566.
- ^ Hayashi, Fumio (2000). Econometrics. Princeton University Press. ISBN 978-0-691-01018-2.
- ^ Angrist, Joshua David; Pischke, Jörn-Steffen (2015). Mastering ‘metrics : the path from cause to effect. Princeton, New Jersey. p. 221. ISBN 978-0-691-15283-7. OCLC 877846199.
The bias generated by this sort of measurement error in regressors is called attenuation bias.
Further reading[edit]
- Cochran, W. G. (1968). «Errors of Measurement in Statistics». Technometrics. 10 (4): 637–666. doi:10.2307/1267450. JSTOR 1267450.