Capture detailed information about errors and request processing in log files, either locally or via syslog.
This article describes how to configure logging of errors and processed requests in NGINX Open Source and NGINX Plus.
Setting Up the Error Log
NGINX writes information about encountered issues of different severity levels to the error log. The error_log directive sets up logging to a particular file, stderr, or syslog and specifies the minimal severity level of messages to log. By default, the error log is located at logs/error.log (the absolute path depends on the operating system and installation), and messages from all severity levels above the one specified are logged.
The configuration below changes the minimal severity level of error messages to log from error to warn:
error_log logs/error.log warn;
In this case, messages of warn, error crit, alert, and emerg levels are logged.
The default setting of the error log works globally. To override it, place the error_log directive in the main (top-level) configuration context. Settings in the main context are always inherited by other configuration levels (http, server, location). The error_log directive can be also specified at the http, stream, server and location levels and overrides the setting inherited from the higher levels. In case of an error, the message is written to only one error log, the one closest to the level where the error has occurred. However, if several error_log directives are specified on the same level, the message are written to all specified logs.
Note: The ability to specify multiple
error_logdirectives on the same configuration level was added in NGINX Open Source version 1.5.2.
Setting Up the Access Log
NGINX writes information about client requests in the access log right after the request is processed. By default, the access log is located at logs/access.log, and the information is written to the log in the predefined combined format. To override the default setting, use the log_format directive to change the format of logged messages, as well as the access_log directive to specify the location of the log and its format. The log format is defined using variables.
The following examples define the log format that extends the predefined combined format with the value indicating the ratio of gzip compression of the response. The format is then applied to a virtual server that enables compression.
http {
    log_format compression '$remote_addr - $remote_user [$time_local] '
                           '"$request" $status $body_bytes_sent '
                           '"$http_referer" "$http_user_agent" "$gzip_ratio"';

    server {
        gzip on;
        access_log /spool/logs/nginx-access.log compression;
        ...
    }
}
Another example of the log format enables tracking different time values between NGINX and an upstream server that may help to diagnose a problem if your website experience slowdowns. You can use the following variables to log the indicated time values:
$upstream_connect_time– The time spent on establishing a connection with an upstream server$upstream_header_time– The time between establishing a connection and receiving the first byte of the response header from the upstream server$upstream_response_time– The time between establishing a connection and receiving the last byte of the response body from the upstream server$request_time– The total time spent processing a request
All time values are measured in seconds with millisecond resolution.
http {
    log_format upstream_time '$remote_addr - $remote_user [$time_local] '
                             '"$request" $status $body_bytes_sent '
                             '"$http_referer" "$http_user_agent"'
                             'rt=$request_time uct="$upstream_connect_time" uht="$upstream_header_time" urt="$upstream_response_time"';

    server {
        access_log /spool/logs/nginx-access.log upstream_time;
        ...
    }
}
When reading the resulting time values, keep the following in mind:
- When a request is processed through several servers, the variable contains several values separated by commas
- When there is an internal redirect from one upstream group to another, the values are separated by semicolons
- When a request is unable to reach an upstream server or a full header cannot be received, the variable contains
0(zero) - In case of internal error while connecting to an upstream or when a reply is taken from the cache, the variable contains
-(hyphen)
Logging can be optimized by enabling the buffer for log messages and the cache of descriptors of frequently used log files whose names contain variables. To enable buffering use the buffer parameter of the access_log directive to specify the size of the buffer. The buffered messages are then written to the log file when the next log message does not fit into the buffer as well as in some other cases.
To enable caching of log file descriptors, use the open_log_file_cache directive.
Similar to the error_log directive, the access_log directive defined on a particular configuration level overrides the settings from the previous levels. When processing of a request is completed, the message is written to the log that is configured on the current level, or inherited from the previous levels. If one level defines multiple access logs, the message is written to all of them.
Enabling Conditional Logging
Conditional logging allows excluding trivial or unimportant log entries from the access log. In NGINX, conditional logging is enabled by the if parameter to the access_log directive.
This example excludes requests with HTTP status codes 2xx (Success) and 3xx (Redirection):
map $status $loggable {
    ~^[23]  0;
    default 1;
}

access_log /path/to/access.log combined if=$loggable;
Usecase: Sampling TLS Parameters
Many clients use TLS versions older than TLS 1.3. Though many ciphers are declared insecure, older implementations still use them; ECC certificates offer greater performance than RSA, but not all clients can accept ECC. Many TLS attacks rely on a “man in the middle” who intercepts the cipher negotiation handshake and forces the client and server to select a less secure cipher. Therefore, it’s important to configure NGINX Plus to not support weak or legacy ciphers, but doing so may exclude legacy clients.
You can evaluate the SSL data obtained from the client and determine what proportion of clients get excluded if support for older SSL protocols and ciphers is removed.
The following configuration example logs the SSL protocol, cipher, and User-Agent header of any connected TLS client, assuming that each client selects the most recent protocol and most secure ciphers it supports.
In this example, each client is identified by its unique combination of IP address and User-Agent.
-
Define the custom log format
sslparamsthat includes the version of the SSL protocol ($ssl_protocol), ciphers used in the connection ($ssl_cipher), the client IP address ($remote_addr), and the value of standardUser AgentHTTP request field ($http_user_agent):log_format sslparams '$ssl_protocol $ssl_cipher ' '$remote_addr "$http_user_agent"'; -
Define a key-value storage that will keep the IP address of the client and its User Agent, for example,
clients:keyval_zone zone=clients:80m timeout=3600s; -
Create a variable, for example,
$seenfor each unique combination of$remote_addrandUser-Agentheader:keyval $remote_addr:$http_user_agent $seen zone=clients; server { listen 443 ssl; ssl_protocols TLSv1 TLSv1.1 TLSv1.2; ssl_ciphers HIGH:!aNULL:!MD5; if ($seen = "") { set $seen 1; set $logme 1; } access_log /tmp/sslparams.log sslparams if=$logme; # ... } -
View the log file generated with this configuration:
TLSv1.2 AES128-SHA 1.1.1.1 "Mozilla/5.0 (X11; Linux x86_64; rv:45.0) Gecko/20100101 Firefox/45.0" TLSv1.2 ECDHE-RSA-AES128-GCM-SHA256 2.2.2.2 "Mozilla/5.0 (iPhone; CPU iPhone OS 9_1 like Mac OS X) AppleWebKit/601.1.46 (KHTML, like Gecko) Version/9.0 Mobile/13B143 Safari/601.1" TLSv1.2 ECDHE-RSA-AES128-GCM-SHA256 3.3.3.3 "Mozilla/5.0 (Windows NT 6.1; WOW64; rv:58.0) Gecko/20100101 Firefox/58.0" TLSv1.2 ECDHE-RSA-AES128-GCM-SHA256 4.4.4.4 "Mozilla/5.0 (Android 4.4.2; Tablet; rv:65.0) Gecko/65.0 Firefox/65.0" TLSv1 AES128-SHA 5.5.5.5 "Mozilla/5.0 (Android 4.4.2; Tablet; rv:65.0) Gecko/65.0 Firefox/65.0" TLSv1.2 ECDHE-RSA-CHACHA20-POLY1305 6.6.6.6 "Mozilla/5.0 (Linux; U; Android 5.0.2; en-US; XT1068 Build/LXB22.46-28) AppleWebKit/537.36 (KHTML, like Gecko) Version/4.0 Chrome/57.0.2987.108 UCBrowser/12.10.2.1164 Mobile Safari/537.36" -
Process the log file to determine the spread of data:
cat /tmp/sslparams.log | cut -d ' ' -f 2,2 | sort | uniq -c | sort -rn | perl -ane 'printf "%30s %sn", $F[1], "="x$F[0];'In this output, low‑volume, less secure ciphers are identified:
ECDHE-RSA-AES128-GCM-SHA256 =========================
ECDHE-RSA-AES256-GCM-SHA384 ========
                 AES128-SHA ====
ECDHE-RSA-CHACHA20-POLY1305 ==
    ECDHE-RSA-AES256-SHA384 ==
Then you can check the logs to determine which clients are using these ciphers and then make a decision about removing these ciphers from the NGINX Plus configuration.
For more information about sampling requests with NGINX conditional logging see the blog post.
Logging to Syslog
The syslog utility is a standard for computer message logging and allows collecting log messages from different devices on a single syslog server. In NGINX, logging to syslog is configured with the syslog: prefix in error_log and access_log directives.
Syslog messages can be sent to a server= which can be a domain name, an IP address, or a UNIX-domain socket path. A domain name or IP address can be specified with a port to override the default port, 514. A UNIX-domain socket path can be specified after the unix: prefix:
error_log  syslog:server=unix:/var/log/nginx.sock debug;
access_log syslog:server=[2001:db8::1]:1234,facility=local7,tag=nginx,severity=info;
In the example, NGINX error log messages are written to a UNIX domain socket at the debug logging level, and the access log is written to a syslog server with an IPv6 address and port 1234.
The facility= parameter specifies the type of program that is logging the message. The default value is local7. Other possible values are: auth, authpriv, daemon, cron, ftp, lpr, kern, mail, news, syslog, user, uucp, local0 ... local7.
The tag= parameter applies a custom tag to syslog messages (nginx in our example).
The severity= parameter sets the severity level of syslog messages for access log. Possible values in order of increasing severity are: debug, info, notice, warn, error (default), crit, alert, and emerg. Messages are logged at the specified level and all more severe levels. In our example, the severity level error also enables crit, alert, and emerg levels to be logged.
Live Activity Monitoring
NGINX Plus provides a real-time live activity monitoring interface that shows key load and performance metrics of your HTTP and TCP upstream servers. See the Live Activity Monitoring article for more information.
To learn more about NGINX Plus, please visit the Products page.
Example Configuration
user www www;
worker_processes 2;

error_log /var/log/nginx-error.log info;

events {
    use kqueue;
    worker_connections 2048;
}

...
Directives
| Syntax: |
accept_mutex
|
|---|---|
| Default: |
accept_mutex off; |
| Context: |
events
|
If accept_mutex is enabled,
worker processes will accept new connections by turn.
Otherwise, all worker processes will be notified about new connections,
and if volume of new connections is low, some of the worker processes
may just waste system resources.
There is no need to enable
accept_mutex
on systems that support the
EPOLLEXCLUSIVE flag (1.11.3) or
when using reuseport.
Prior to version 1.11.3, the default value was
on.
| Syntax: |
accept_mutex_delay
|
|---|---|
| Default: |
accept_mutex_delay 500ms; |
| Context: |
events
|
If accept_mutex is enabled, specifies the maximum time
during which a worker process will try to restart accepting new
connections if another worker process is currently accepting
new connections.
| Syntax: |
daemon
|
|---|---|
| Default: |
daemon on; |
| Context: |
main
|
Determines whether nginx should become a daemon.
Mainly used during development.
| Syntax: |
debug_connection
|
|---|---|
| Default: |
— |
| Context: |
events
|
Enables debugging log for selected client connections.
Other connections will use logging level set by the
error_log directive.
Debugged connections are specified by IPv4 or IPv6 (1.3.0, 1.2.1)
address or network.
A connection may also be specified using a hostname.
For connections using UNIX-domain sockets (1.3.0, 1.2.1),
debugging log is enabled by the “unix:” parameter.
events {
    debug_connection 127.0.0.1;
    debug_connection localhost;
    debug_connection 192.0.2.0/24;
    debug_connection ::1;
    debug_connection 2001:0db8::/32;
    debug_connection unix:;
    ...
}
For this directive to work, nginx needs to
be built with--with-debug,
see “A debugging log”.
| Syntax: |
debug_points
|
|---|---|
| Default: |
— |
| Context: |
main
|
This directive is used for debugging.
When internal error is detected, e.g. the leak of sockets on
restart of working processes, enabling debug_points
leads to a core file creation (abort)
or to stopping of a process (stop) for further
analysis using a system debugger.
| Syntax: |
env
|
|---|---|
| Default: |
env TZ; |
| Context: |
main
|
By default, nginx removes all environment variables inherited
from its parent process except the TZ variable.
This directive allows preserving some of the inherited variables,
changing their values, or creating new environment variables.
These variables are then:
-
inherited during a live upgrade
of an executable file; -
used by the
ngx_http_perl_module module; -
used by worker processes.
One should bear in mind that controlling system libraries in this way
is not always possible as it is common for libraries to check
variables only during initialization, well before they can be set
using this directive.
An exception from this is an above mentioned
live upgrade
of an executable file.
The TZ variable is always inherited and available to the
ngx_http_perl_module
module, unless it is configured explicitly.
Usage example:
env MALLOC_OPTIONS;
env PERL5LIB=/data/site/modules;
env OPENSSL_ALLOW_PROXY_CERTS=1;
The NGINX environment variable is used internally by nginx
and should not be set directly by the user.
| Syntax: |
error_log
|
|---|---|
| Default: |
error_log logs/error.log error; |
| Context: |
main, http, mail, stream, server, location
|
Configures logging.
Several logs can be specified on the same configuration level (1.5.2).
If on the main configuration level writing a log to a file
is not explicitly defined, the default file will be used.
The first parameter defines a file that will store the log.
The special value stderr selects the standard error file.
Logging to syslog can be configured by specifying
the “syslog:” prefix.
Logging to a
cyclic memory buffer
can be configured by specifying the “memory:” prefix and
buffer size, and is generally used for debugging (1.7.11).
The second parameter determines the level of logging,
and can be one of the following:
debug, info, notice,
warn, error, crit,
alert, or emerg.
Log levels above are listed in the order of increasing severity.
Setting a certain log level will cause all messages of
the specified and more severe log levels to be logged.
For example, the default level error will
cause error, crit,
alert, and emerg messages
to be logged.
If this parameter is omitted then error is used.
For
debuglogging to work, nginx needs to
be built with--with-debug,
see “A debugging log”.
The directive can be specified on the
streamlevel
starting from version 1.7.11,
and on the
starting from version 1.9.0.
| Syntax: |
events { ... }
|
|---|---|
| Default: |
— |
| Context: |
main
|
Provides the configuration file context in which the directives that
affect connection processing are specified.
| Syntax: |
include
|
|---|---|
| Default: |
— |
| Context: |
any
|
Includes another file, or files matching the
specified mask, into configuration.
Included files should consist of
syntactically correct directives and blocks.
Usage example:
include mime.types;
include vhosts/*.conf;
| Syntax: |
load_module
|
|---|---|
| Default: |
— |
| Context: |
main
|
This directive appeared in version 1.9.11.
Loads a dynamic module.
Example:
load_module modules/ngx_mail_module.so;
| Syntax: |
lock_file
|
|---|---|
| Default: |
lock_file logs/nginx.lock; |
| Context: |
main
|
nginx uses the locking mechanism to implement accept_mutex
and serialize access to shared memory.
On most systems the locks are implemented using atomic operations,
and this directive is ignored.
On other systems the “lock file” mechanism is used.
This directive specifies a prefix for the names of lock files.
| Syntax: |
master_process
|
|---|---|
| Default: |
master_process on; |
| Context: |
main
|
Determines whether worker processes are started.
This directive is intended for nginx developers.
| Syntax: |
multi_accept
|
|---|---|
| Default: |
multi_accept off; |
| Context: |
events
|
If multi_accept is disabled, a worker process
will accept one new connection at a time.
Otherwise, a worker process
will accept all new connections at a time.
The directive is ignored if kqueue
connection processing method is used, because it reports
the number of new connections waiting to be accepted.
| Syntax: |
pcre_jit
|
|---|---|
| Default: |
pcre_jit off; |
| Context: |
main
|
This directive appeared in version 1.1.12.
Enables or disables the use of “just-in-time compilation” (PCRE JIT)
for the regular expressions known by the time of configuration parsing.
PCRE JIT can speed up processing of regular expressions significantly.
The JIT is available in PCRE libraries starting from version 8.20
built with the--enable-jitconfiguration parameter.
When the PCRE library is built with nginx (--with-pcre=),
the JIT support is enabled via the
--with-pcre-jitconfiguration parameter.
| Syntax: |
pid
|
|---|---|
| Default: |
pid logs/nginx.pid; |
| Context: |
main
|
Defines a file that will store the process ID of the main process.
| Syntax: |
ssl_engine
|
|---|---|
| Default: |
— |
| Context: |
main
|
Defines the name of the hardware SSL accelerator.
| Syntax: |
thread_pool
|
|---|---|
| Default: |
thread_pool default threads=32 max_queue=65536; |
| Context: |
main
|
This directive appeared in version 1.7.11.
Defines the name and parameters of a thread pool
used for multi-threaded reading and sending of files
without blocking
worker processes.
The threads parameter
defines the number of threads in the pool.
In the event that all threads in the pool are busy,
a new task will wait in the queue.
The max_queue parameter limits the number
of tasks allowed to be waiting in the queue.
By default, up to 65536 tasks can wait in the queue.
When the queue overflows, the task is completed with an error.
| Syntax: |
timer_resolution
|
|---|---|
| Default: |
— |
| Context: |
main
|
Reduces timer resolution in worker processes, thus reducing the
number of gettimeofday() system calls made.
By default, gettimeofday() is called each time
a kernel event is received.
With reduced resolution, gettimeofday() is only
called once per specified interval.
Example:
timer_resolution 100ms;
Internal implementation of the interval depends on the method used:
-
the
EVFILT_TIMERfilter ifkqueueis used; -
timer_create()ifeventportis used; -
setitimer()otherwise.
| Syntax: |
use
|
|---|---|
| Default: |
— |
| Context: |
events
|
Specifies the connection processing
method to use.
There is normally no need to specify it explicitly, because nginx will
by default use the most efficient method.
| Syntax: |
user
|
|---|---|
| Default: |
user nobody nobody; |
| Context: |
main
|
Defines user and group
credentials used by worker processes.
If group is omitted, a group whose name equals
that of user is used.
| Syntax: |
worker_aio_requests
|
|---|---|
| Default: |
worker_aio_requests 32; |
| Context: |
events
|
This directive appeared in versions 1.1.4 and 1.0.7.
When using aio
with the epoll
connection processing method, sets the maximum number of
outstanding asynchronous I/O operations
for a single worker process.
| Syntax: |
worker_connections
|
|---|---|
| Default: |
worker_connections 512; |
| Context: |
events
|
Sets the maximum number of simultaneous connections that
can be opened by a worker process.
It should be kept in mind that this number includes all connections
(e.g. connections with proxied servers, among others),
not only connections with clients.
Another consideration is that the actual number of simultaneous
connections cannot exceed the current limit on
the maximum number of open files, which can be changed by
worker_rlimit_nofile.
| Syntax: |
worker_cpu_affinity worker_cpu_affinity
|
|---|---|
| Default: |
— |
| Context: |
main
|
Binds worker processes to the sets of CPUs.
Each CPU set is represented by a bitmask of allowed CPUs.
There should be a separate set defined for each of the worker processes.
By default, worker processes are not bound to any specific CPUs.
For example,
worker_processes    4;
worker_cpu_affinity 0001 0010 0100 1000;
binds each worker process to a separate CPU, while
worker_processes    2;
worker_cpu_affinity 0101 1010;
binds the first worker process to CPU0/CPU2,
and the second worker process to CPU1/CPU3.
The second example is suitable for hyper-threading.
The special value auto (1.9.10) allows
binding worker processes automatically to available CPUs:
worker_processes auto;
worker_cpu_affinity auto;
The optional mask parameter can be used to limit the CPUs
available for automatic binding:
worker_cpu_affinity auto 01010101;
The directive is only available on FreeBSD and Linux.
| Syntax: |
worker_priority
|
|---|---|
| Default: |
worker_priority 0; |
| Context: |
main
|
Defines the scheduling priority for worker processes like it is
done by the nice command: a negative
number
means higher priority.
Allowed range normally varies from -20 to 20.
Example:
worker_priority -10;
| Syntax: |
worker_processes
|
|---|---|
| Default: |
worker_processes 1; |
| Context: |
main
|
Defines the number of worker processes.
The optimal value depends on many factors including (but not
limited to) the number of CPU cores, the number of hard disk
drives that store data, and load pattern.
When one is in doubt, setting it to the number of available CPU cores
would be a good start (the value “auto”
will try to autodetect it).
The
autoparameter is supported starting from
versions 1.3.8 and 1.2.5.
| Syntax: |
worker_rlimit_core
|
|---|---|
| Default: |
— |
| Context: |
main
|
Changes the limit on the largest size of a core file
(RLIMIT_CORE) for worker processes.
Used to increase the limit without restarting the main process.
| Syntax: |
worker_rlimit_nofile
|
|---|---|
| Default: |
— |
| Context: |
main
|
Changes the limit on the maximum number of open files
(RLIMIT_NOFILE) for worker processes.
Used to increase the limit without restarting the main process.
| Syntax: |
worker_shutdown_timeout
|
|---|---|
| Default: |
— |
| Context: |
main
|
This directive appeared in version 1.11.11.
Configures a timeout for a graceful shutdown of worker processes.
When the time expires,
nginx will try to close all the connections currently open
to facilitate shutdown.
| Syntax: |
working_directory
|
|---|---|
| Default: |
— |
| Context: |
main
|
Defines the current working directory for a worker process.
It is primarily used when writing a core-file, in which case
a worker process should have write permission for the
specified directory.
In this tutorial, you will learn everything you need to know about logging in
NGINX and how it can help you troubleshoot and quickly resolve any problem you
may encounter on your web server. We will discuss where the logs are stored and
how to access them, how to customize their format, and how to centralize them in
one place with Syslog or a log management service.
Here’s an outline of what you will learn by following through with this tutorial:
- Where NGINX logs are stored and how to access them.
- How to customize the NGINX log format and storage location to fit your needs.
- How to utilize a structured format (such as JSON) for your NGINX logs.
- How to centralize NGINX logs through Syslog or a managed cloud-based service.
Prerequisites
To follow through with this tutorial, you need the following:
- A Linux server that includes a non-root user with
sudoprivileges. We tested
the commands shown in this guide on an Ubuntu 20.04 server. - The
NGINX web server installedand enabled on your server.
🔭 Want to centralize and monitor your NGINX logs?
Head over to Logtail and start ingesting your logs in 5 minutes.
Step 1 — Locating the NGINX log files
NGINX writes logs of all its events in two different log files:
- Access log: this file contains information about incoming requests and
user visits. - Error log: this file contains information about errors encountered while
processing requests, or other diagnostic messages about the web server.
The location of both log files is dependent on the host operating system of the
NGINX web server and the mode of installation. On most Linux distributions, both
files will be found in the /var/log/nginx/ directory as access.log and
error.log, respectively.
A typical access log entry might look like the one shown below. It describes an
HTTP GET request to the server for a favicon.ico file.
Output
217.138.222.101 - - [11/Feb/2022:13:22:11 +0000] "GET /favicon.ico HTTP/1.1" 404 3650 "http://135.181.110.245/" "Mozilla/5.0 (Windows NT 10.0; Win64; x64) AppleWebKit/537.36 (KHTML, like Gecko) Chrome/98.0.4758.87 Safari/537.36" "-"
Similarly, an error log entry might look like the one below, which was generated
due to the inability of the server to locate the favicon.ico file that was
requested above.
Output
2022/02/11 13:12:24 [error] 37839#37839: *7 open() "/usr/share/nginx/html/favicon.ico" failed (2: No such file or directory), client: 113.31.102.176, server: _, request: "GET /favicon.ico HTTP/1.1", host: "192.168.110.245:80"
In the next section, you’ll see how to view both NGINX log files from the
command line.
Step 2 — Viewing the NGINX log files
Examining the NGINX logs can be done in a variety of ways. One of the most
common methods involves using the tail command to view logs entries in
real-time:
sudo tail -f /var/log/nginx/access.log
You will observe the following output:
Output
107.189.10.196 - - [14/Feb/2022:03:48:55 +0000] "POST /HNAP1/ HTTP/1.1" 404 134 "-" "Mozila/5.0"
35.162.122.225 - - [14/Feb/2022:04:11:57 +0000] "GET /.env HTTP/1.1" 404 162 "-" "Mozilla/5.0 (Windows NT 10.0; Win64; x64; rv:58.0) Gecko/20100101 Firefox/58.0"
45.61.172.7 - - [14/Feb/2022:04:16:54 +0000] "GET /.env HTTP/1.1" 404 197 "-" "Mozilla/5.0 (X11; Linux x86_64) AppleWebKit/537.36 (KHTML, like Gecko) Chrome/81.0.4044.129 Safari/537.36"
45.61.172.7 - - [14/Feb/2022:04:16:55 +0000] "POST / HTTP/1.1" 405 568 "-" "Mozilla/5.0 (X11; Linux x86_64) AppleWebKit/537.36 (KHTML, like Gecko) Chrome/81.0.4044.129 Safari/537.36"
45.137.21.134 - - [14/Feb/2022:04:18:57 +0000] "GET /dispatch.asp HTTP/1.1" 404 134 "-" "Mozilla/5.0 (iPad; CPU OS 7_1_2 like Mac OS X; en-US) AppleWebKit/531.5.2 (KHTML, like Gecko) Version/4.0.5 Mobile/8B116 Safari/6531.5.2"
23.95.100.141 - - [14/Feb/2022:04:42:23 +0000] "HEAD / HTTP/1.0" 200 0 "-" "-"
217.138.222.101 - - [14/Feb/2022:07:38:40 +0000] "GET /icons/ubuntu-logo.png HTTP/1.1" 404 197 "http://168.119.119.25/" "Mozilla/5.0 (Windows NT 10.0; Win64; x64) AppleWebKit/537.36 (KHTML, like Gecko) Chrome/98.0.4758.87 Safari/537.36"
217.138.222.101 - - [14/Feb/2022:07:38:42 +0000] "GET /favicon.ico HTTP/1.1" 404 197 "http://168.119.119.25/" "Mozilla/5.0 (Windows NT 10.0; Win64; x64) AppleWebKit/537.36 (KHTML, like Gecko) Chrome/98.0.4758.87 Safari/537.36"
217.138.222.101 - - [14/Feb/2022:07:44:02 +0000] "GET / HTTP/1.1" 304 0 "-" "Mozilla/5.0 (Windows NT 10.0; Win64; x64) AppleWebKit/537.36 (KHTML, like Gecko) Chrome/98.0.4758.87 Safari/537.36"
217.138.222.101 - - [14/Feb/2022:07:44:02 +0000] "GET /icons/ubuntu-logo.png HTTP/1.1" 404 197 "http://168.119.119.25/" "Mozilla/5.0 (Windows NT 10.0; Win64; x64) AppleWebKit/537.36 (KHTML, like Gecko) Chrome/98.0.4758.87 Safari/537.36"
The tail command prints the last 10 lines from the selected file. The -f
option causes it to continue displaying subsequent lines that are added to the
file in real-time.
To examine the entire contents of an NGINX log file, you can use the cat
command or open it in your text editor:
sudo cat /var/log/nginx/error.log
If you want to filter the lines that contain a specific term, you can use the
grep command as shown below:
sudo grep "GET /favicon.ico" /var/log/nginx/access.log
The command above will print all the lines that contain GET /favicon.ico so we
can see how many requests were made for that resource.
Step 3 — Configuring NGINX access logs
The NGINX access log stores data about incoming client requests to the server
which is beneficial when deciphering what users are doing in the application,
and what resources are being requested. In this section, you will learn how to
configure what data is stored in the access log.
One thing to keep in mind while following through with the instructions below is
that you’ll need to restart the nginx service after modifying the config file
so that the changes can take effect.
sudo systemctl restart nginx
Enabling the access log
The NGINX access Log should be enabled by default. However, if this is not the
case, you can enable it manually in the Nginx configuration file
(/etc/nginx/nginx.conf) using the access_log directive within the http
block.
Output
http {
  access_log /var/log/nginx/access.log;
}
This directive is also applicable in the server and location configuration
blocks for a specific website:
Output
server {
   access_log /var/log/nginx/app1.access.log;

  location /app2 {
    access_log /var/log/nginx/app2.access.log;
  }
}
Disabling the access log
In cases where you’d like to disable the NGINX access log, you can use the
special off value:
You can also disable the access log on a virtual server or specific URIs by
editing its server or location block configuration in the
/etc/nginx/sites-available/ directory:
Output
server {
  listen 80;

  access_log off;

  location ~* .(woff|jpg|jpeg|png|gif|ico|css|js)$ {
    access_log off;
  }
}
Logging to multiple access log files
If you’d like to duplicate the access log entries in separate files, you can do
so by repeating the access_log directive in the main config file or in a
server block as shown below:
Output
access_log /var/log/nginx/access.log;
access_log /var/log/nginx/combined.log;
Don’t forget to restart the nginx service afterward:
sudo systemctl restart nginx
Explanation of the default access log format
The access log entries produced using the default configuration will look like
this:
Output
127.0.0.1 alice Alice [07/May/2021:10:44:53 +0200] "GET / HTTP/1.1" 200 396 "-" "Mozilla/5.0 (Windows NT 10.0; Win64; x64) AppleWebKit/537.36 (KHTML, like Gecko) Chrome/90.0.4531.93 Safari/537.36"
Here’s a breakdown of the log message above:
127.0.0.1: the IP address of the client that made the request.alice: remote log name (name used to log in a user).Alice: remote username (username of logged-in user).[07/May/2021:10:44:53 +0200]: date and time of the request."GET / HTTP/1.1": request method, path and protocol.200: the HTTP response code.396: the size of the response in bytes."-": the IP address of the referrer (-is used when the it is not
available)."Mozilla/5.0 (Windows NT 10.0; Win64; x64) AppleWebKit/537.36 (KHTML, like Gecko) Chrome/90.0.4531.93 Safari/537.36"—
detailed user agent information.
Step 4 — Creating a custom log format
Customizing the format of the entries in the access log can be done using the
log_format directive, and it can be placed in the http, server or
location blocks as needed. Here’s an example of what it could look like:
Output
log_format custom '$remote_addr - $remote_user [$time_local] ' '"$request" $status $body_bytes_sent ' '"$http_referer" "$http_user_agent"';
This yields a log entry in the following format:
Output
217.138.222.109 - - [14/Feb/2022:10:38:35 +0000] "GET /favicon.ico HTTP/1.1" 404 197 "http://192.168.100.1/" "Mozilla/5.0 (Windows NT 10.0; Win64; x64) AppleWebKit/537.36 (KHTML, like Gecko) Chrome/98.0.4758.87 Safari/537.36"
The syntax for configuring an access log format is shown below. First, you need
to specify a nickname for the format that will be used as its identifier, and
then the log format string that represents the details and formatting for each
log message.
Output
log_format <nickname> '<formatting_variables>';
Here’s an explanation of each variable used in the custom log format shown
above:
$remote_addr: the IP address of the client$remote_user: information about the user making the request$time_local: the server’s date and time.$request: actual request details like path, method, and protocol.$status: the response code.$body_bytes_sent: the size of the response in bytes.$http_referer: the IP address of the HTTP referrer.$http_user_agent: detailed user agent information.
You may also use the following variables in your custom log format
(see here for the complete list
):
$upstream_connect_time: the time spent establishing a connection with an
upstream server.$upstream_header_time: the time between establishing a connection and
receiving the first byte of the response header from the upstream server.$upstream_response_time: the time between establishing a connection and
receiving the last byte of the response body from the upstream server.$request_time: the total time spent processing a request.$gzip_ratio: ration of gzip compression (if gzip is enabled).
After you create a custom log format, you can apply it to a log file by
providing a second parameter to the access_log directive:
Output
access_log /var/log/nginx/access.log custom;
You can use this feature to log different information in to separate log files.
Create the log formats first:
Output
log_format custom '$remote_addr - $remote_user [$time_local] ' '"$request" $status $body_bytes_sent ' '"$http_referer"';
log_format agent "$http_user_agent";
Then, apply them as shown below:
Output
access_log /var/log/nginx/access.log custom;
access_log /var/log/nginx/agent_access.log agent;
This configuration ensures that user agent information for all incoming requests
are logged into a separate access log file.
Step 5 — Formatting your access logs as JSON
A common way to customize NGINX access logs is to format them as JSON. This is
quite straightforward to achieve by combining the log_format directive with
the escape=json parameter introduced in Nginx 1.11.8 to escape characters that
are not valid in JSON:
Output
log_format custom_json escape=json
  '{'
    '"time_local":"$time_local",'
    '"remote_addr":"$remote_addr",'
    '"remote_user":"$remote_user",'
    '"request":"$request",'
    '"status": "$status",'
    '"body_bytes_sent":"$body_bytes_sent",'
    '"request_time":"$request_time",'
    '"http_referrer":"$http_referer",'
    '"http_user_agent":"$http_user_agent"'
  '}';
After applying the custom_json format to a log file and restarting the nginx
service, you will observe log entries in the following format:
{
  "time_local": "14/Feb/2022:11:25:44 +0000",
  "remote_addr": "217.138.222.109",
  "remote_user": "",
  "request": "GET /icons/ubuntu-logo.png HTTP/1.1",
  "status": "404",
  "body_bytes_sent": "197",
  "request_time": "0.000",
  "http_referrer": "http://192.168.100.1/",
  "http_user_agent": "Mozilla/5.0 (Windows NT 10.0; Win64; x64) AppleWebKit/537.36 (KHTML, like Gecko) Chrome/98.0.4758.87 Safari/537.36"
}
Step 6 — Configuring NGINX error logs
Whenever NGINX encounters an error, it stores the event data in the error log so
that it can be referred to later by a system administrator. This section will
describe how to enable and customize the error logs as you see fit.
Enabling the error log
The NGINX error log should be enabled by default. However, if this is not the
case, you can enable it manually in the relevant NGINX configuration file
(either at the http, server, or location levels) using the error_log
directive.
Output
error_log /var/log/nginx/error.log;
The error_log directive can take two parameters. The first one is the location
of the log file (as shown above), while the second one is optional and sets the
severity level of the log. Events with a lower severity level than set one will
not be logged.
Output
error_log /var/log/nginx/error.log info;
These are the possible levels of severity (from lowest to highest) and their
meaning:
debug: messages used for debugging.info: informational messages.notice: a notable event occurred.warn: something unexpected happened.error: something failed.crit: critical conditions.alert: errors that require immediate action.emerg: the system is unusable.
Disabling the error log
The NGINX error log can be disabled by setting the error_log directive to
off or by redirecting it to /dev/null:
Output
error_log off;
error_log /dev/null;
Logging errors into multiple files
As is the case with access logs, you can log errors into multiple files, and you
can use different severity levels too:
Output
error_log /var/log/nginx/error.log info;
error_log /var/log/nginx/emerg_error.log emerg;
This configuration will log every event except those at the debug level event
to the error.log file, while emergency events are placed in a separate
emerg_error.log file.
Step 7 — Sending NGINX logs to Syslog
Apart from logging to a file, it’s also possible to set up NGINX to transport
its logs to the syslog service especially if you’re already using it for other
system logs. Logging to syslog is done by specifying the syslog: prefix to
either the access_log or error_log directive:
Output
error_log  syslog:server=unix:/var/log/nginx.sock debug;
access_log syslog:server=[127.0.0.1]:1234,facility=local7,tag=nginx,severity=info;
Log messages are sent to a server which can be specified in terms of a domain
name, IPv4 or IPv6 address or a UNIX-domain socket path.
In the example above, error log messages are sent to a UNIX domain socket at the
debug logging level, while the access log is written to a syslog server with
an IPv4 address and port 1234. The facility= parameter specifies the type of
program that is logging the message, the tag= parameter applies a custom tag
to syslog messages, and the severity= parameter sets the severity level of
the syslog entry for access log messages.
For more information on using Syslog to manage your logs, you can check out our
tutorial on viewing and configuring system logs on
Linux.
Step 8 — Centralizing your NGINX logs
In this section, we’ll describe how you can centralize your NGINX logs in a log
management service through Vector
, a
high-performance tool for building observability pipelines. This is a crucial
step when administrating multiple servers so that you can monitor all your logs
in one place (you can also centralize your logs with an Rsyslog
server).
The following instructions assume that you’ve signed up for a free
Logtail account and retrieved your source
token. Go ahead and follow the relevant
installation instructions for Vector
for your operating system. For example, on Ubuntu, you may run the following
commands to install the Vector CLI:
curl -1sLf  'https://repositories.timber.io/public/vector/cfg/setup/bash.deb.sh'  | sudo -E bash
$ sudo apt install vector
After Vector is installed, confirm that it is up and running through
systemctl:
You should observe that it is active and running:
Output
● vector.service - Vector
     Loaded: loaded (/lib/systemd/system/vector.service; enabled; vendor preset: enabled)
     Active: active (running) since Tue 2022-02-08 10:52:59 UTC; 48s ago
       Docs: https://vector.dev
    Process: 18586 ExecStartPre=/usr/bin/vector validate (code=exited, status=0/SUCCESS)
   Main PID: 18599 (vector)
      Tasks: 3 (limit: 2275)
     Memory: 6.8M
     CGroup: /system.slice/vector.service
             └─18599 /usr/bin/vector
Otherwise, go ahead and start it with the command below.
sudo systemctl start vector
Afterward, change into a root shell and append your Logtail vector configuration
for NGINX into the /etc/vector/vector.toml file using the command below. Don’t
forget to replace the <your_logtail_source_token> placeholder below with your
source token.
sudo -s
$ wget -O ->> /etc/vector/vector.toml
    https://logtail.com/vector-toml/nginx/<your_logtail_source_token>
Then restart the vector service:
sudo systemctl restart vector
You will observe that your NGINX logs will start coming through in Logtail:
Conclusion
In this tutorial, you learned about the different types of logs that the NGINX
web server keeps, where you can find them, how to understand their formatting.
We also discussed how to create your own custom log formats (including a
structured JSON format), and how to log into multiple files at once. Finally, we
demonstrated the process of sending your logs to Syslog or a log management
service so that you can monitor them all in one place.
Thanks for reading, and happy logging!
Centralize all your logs into one place.
Analyze, correlate and filter logs with SQL.
Create actionable
dashboards.
Share and comment with built-in collaboration.
Got an article suggestion?
Let us know


Next article
How to Get Started with Logging in Node.js
Learn how to start logging with Node.js and go from basics to best practices in no time.
→

This work is licensed under a Creative Commons Attribution-NonCommercial-ShareAlike 4.0 International License.

Вы используете Nginx? А как у вас организован мониторинг логов Nginx?
Знаете ли вы, что мониторя логи nginx, вы можете значительно повысить стабильность и надежность своего веб-приложения?
В этой статье я покажу вам, как организовать мониторинг логов Nginx, использовать их в качестве метрик и что вообще можно из них выжать.
Зачем мониторить логи Nginx?
Чтобы обеспечить доступность нашей системы — Система считается доступной при отсутствии сбоев или когда количество сбоев не превышает определенный порог. Анализируя статус-коды HTTP, мы можем определить допустимый процент сбоев и следить за доступностью нашей системы.

Для оценки показателей задержки — Доступность, конечно, очень важная метрика, но не менее важны и показатели задержки. Мы потеряем всех клиентов, если наша система будет слишком долго реагировать на их запросы.
Чтобы своевременно удалять устаревшие конечные точки — В идеале мы бы хотели сразу удалять устаревшие конечные точки. Но мы не можем просто взять и сделать это, так как некоторые из наших клиентов могут еще использовать их. Мы могли бы проанализировать использование интересующих нас конечных точек, просмотрев историю, и принимать решение об их удалении, опираясь на реальные данные.
Базовый рабочий процесс
Базовый рабочий процесс решения выглядит следующим образом.
-
Мы собираем метрики Nginx с помощью модуля filebeat [1].
-
Filebeat публикует собранные метрики в elasticsearch.
-
Мы можем визуализировать собранные метрики с помощью Kibana.
-
Мы можем информировать нашу команду с помощью наблюдателей (watchers) [2].
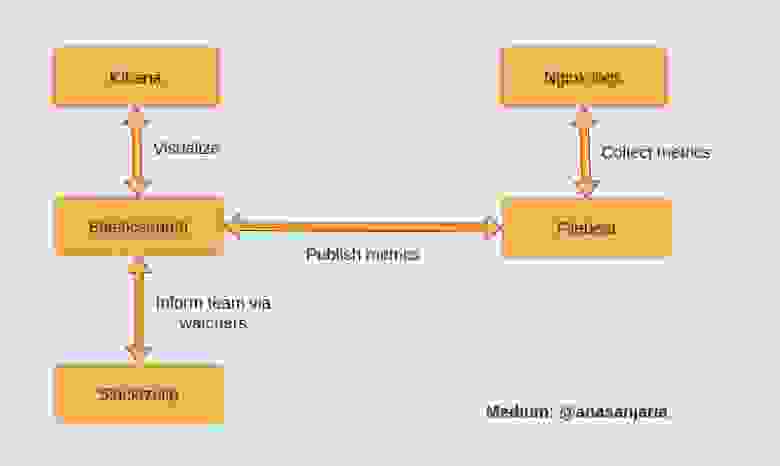
Реализация решения
Весь код можно найти здесь: monitor-nginx-logs
Сбор метрик Nginx
Мы собираем метрики Nginx, используя следующий код:
filebeat.modules:
- module: nginx
  access:
    var.paths: ["/var/log/nginx/host.access.log"]
Метрики публикуются в elasticsearch с помощью следующего кода:
output.elasticsearch:
  hosts: ["http://elasticsearch:9200"]
Вы можете просмотреть собранные метрики, используя Discover в Kibana по адресу localhost:5601. http.response.status_code — интересующая вас метрика.

Визуализация статус-кодов HTTP в Kibana
Выберите Visualize Library и создайте визуализацию


Выберите TSVB.

Сгруппируйте статус-коды HTTP, как показано на следующей диаграмме.

Сразу приношу свои извинения за слабую читабельность текста на изображении. Я попытался увеличить масштаб, но он все равно не читался. Поэтому я выпишу текст ниже:
Часть слева: http.response.status_code>= 200 and http.response.status_code<= 299

Часть справа: 200

По аналогии прописываем это для всех остальных статус-кодов
Наконец, мы можем посмотреть красивую инфографику со статус-кодами HTTP за все время.

Информирование команды о неудачных запросах
Информирование нашей команды мы можем реализовать с помощью специального API наблюдателя [3]. Наблюдатель будет регулярно извлекать данные через определенные промежутки времени и информировать нашу команду, если будет выполняться заданное нами условие. Своевременное получение уведомлений позволит нашей команде действовать наиболее эффективным образом.
Предположим, мы хотим запускать наблюдателя каждый час:
"trigger": {
  "schedule": {
    "interval": "1h"
  }
}
Так как мы храним метрики в индексе filebeat:
"indices": [
  "<filebeat-*-{now/d}>"
]
мы можем определить неудачные запросы, используя следующую конфигурацию:
{
 "size": 0,
 "query": {
  "bool": {
   "must": [
    {
     "range": {
      "@timestamp": {
       "gte": "now-1h"
      }
     }
    },
    {
     "exists": {
      "field": "http.response.status_code"
     }
    }
   ]
  }
 },
 "aggs": {
  "response_code_ranges": {
   "range": {
    "field": "http.response.status_code",
    "keyed": true,
    "ranges": [
     {
      "key": "server_errors",
      "from": 500,
      "to": 599
     }
    ]
   }
  }
 }
}
Следующее условие триггерит наш наблюдатель и сообщит нашей команде, когда процент неудачных запросов превысит 0,3%. Вы можете настроить этот порог в соответствии с вашими соображениями:
"condition": {
  "script": {
    "source": "(double) ctx.payload.aggregations.response_code_ranges.buckets.server_errors.doc_count/(double) ctx.payload.hits.total > params.threshold",
    "lang": "painless",
    "params": {
      "threshold": 0.003
    }
  }
}
Мы можем информировать команду через slack:
-- copied from https://www.elastic.co/guide/en/elasticsearch/reference/7.17/actions-slack.html

"actions" : {
  "notify-slack" : {
    "transform" : { ... },
    "throttle_period" : "5m",
    "slack" : {
      "message" : {
        "to" : [ "#admins", "@chief-admin" ],
        "text" : "..."
      }
    }
  }
}
Спасибо за внимание.
Ресурсы:
[1] filebeat-module-nginx.html
[2] watcher-ui.html
[3] watcher-api-put-watch.html
Материал подготовлен в преддверии старта курса «Observability: мониторинг, логирование, трейсинг». Ознакомиться подробнее с программой обучения и пройти вступительный тест для определения уровня знаний можно по ссылке.
Nginx — это высокопроизводительный HTTP- сервер с открытым исходным кодом и обратный прокси-сервер, отвечающий за обработку нагрузки некоторых из крупнейших сайтов в Интернете. При управлении веб-серверами NGINX одной из наиболее частых задач, которые вы будете выполнять, является проверка файлов журналов.
Знание того, как настраивать и читать журналы, очень полезно при устранении неполадок сервера или приложений, поскольку они предоставляют подробную информацию об отладке.
Nginx записывает свои события в журналы двух типов: журналы доступа и журналы ошибок. Журналы доступа записывают информацию о клиентских запросах, а журналы ошибок записывают информацию о проблемах сервера и приложений.
В этой статье рассказывается, как настроить и прочитать журналы доступа и ошибок Nginx.
Настройка журнала доступа
Каждый раз, когда клиентский запрос обрабатывается, Nginx генерирует новое событие в журнале доступа. Каждая запись события содержит отметку времени и включает различную информацию о клиенте и запрошенном ресурсе. Журналы доступа могут показать вам местоположение посетителей, страницу, которую они посещают, сколько времени они проводят на странице и многое другое.
Директива log_format позволяет вам определять формат регистрируемых сообщений. Директива access_log включает и устанавливает расположение файла журнала и используемый формат.
Самый простой синтаксис директивы access_log следующий:
access_log log_file log_format;
Где log_file — это полный путь к файлу журнала, а log_format — формат, используемый файлом журнала.
Журнал доступа можно включить в блоке http , server или location .
По умолчанию журнал доступа глобально включен в директиве http в основном файле конфигурации Nginx.
/etc/nginx/nginx.conf
http {
  ...
  access_log  /var/log/nginx/access.log;
  ...
}
Для удобства чтения рекомендуется создавать отдельный файл журнала доступа для каждого серверного блока. Директива access_log установленная в директиве server access_log директиву, установленную в директиве http (более высокого уровня).
/etc/nginx/conf.d/domain.com.conf
http {
  ...
  access_log  /var/log/nginx/access.log;
  ...

  server {
    server_name domain.com
    access_log  /var/log/nginx/domain.access.log;
    ...
  }
}
Если формат журнала не указан, Nginx использует предопределенный комбинированный формат, который выглядит следующим образом:
log_format combined '$remote_addr - $remote_user [$time_local] '
                    '"$request" $status $body_bytes_sent '
                    '"$http_referer" "$http_user_agent"';
Чтобы изменить формат ведения журнала, отмените настройку по умолчанию или определите новую. Например, чтобы определить новый формат ведения журнала с именем custom, который расширит комбинированный формат значением, показывающим заголовок X-Forwarded-For добавьте следующее определение в директиву http или server :
log_format  custom  '$remote_addr - $remote_user [$time_local] "$request" '
                    '$status $body_bytes_sent "$http_referer" '
                    '"$http_user_agent" "$http_x_forwarded_for"';
Чтобы использовать новый формат, укажите его имя после файла журнала, как показано ниже:
access_log /var/log/nginx/access.log custom;
Хотя журнал доступа предоставляет очень полезную информацию, он занимает дисковое пространство и может повлиять на производительность сервера. Если на вашем сервере мало ресурсов и у вас загруженный веб-сайт, вы можете отключить журнал доступа. Чтобы сделать это, установите значение access_log директиву off :
Настройка журнала ошибок
Nginx записывает сообщения об ошибках приложения и общих ошибках сервера в файл журнала ошибок. Если вы испытываете ошибки в своем веб-приложении, журнал ошибок — это первое место, с которого можно начать поиск и устранение неисправностей.
Директива error_log включает и устанавливает расположение и уровень серьезности журнала ошибок. Он имеет следующую форму и может быть установлен в блоке http , server или location :
error_log log_file log_level
Параметр log_level устанавливает уровень ведения журнала. Ниже перечислены уровни в порядке их серьезности (от низкого до высокого):
debug—debugсообщения.-
info— Информационные сообщения. -
notice— Уведомления. -
warn— Предупреждения. -
error— Ошибки при обработке запроса. -
crit— Критические проблемы. Требуется быстрое действие. -
alert— Оповещения. Действия должны быть предприняты немедленно. -
emerg— Чрезвычайная ситуация. Система находится в непригодном для использования состоянии.
Каждый уровень журнала включает в себя более высокие уровни. Например, если вы установите уровень журнала , чтобы warn , Nginx будет также регистрировать error , crit , alert и emerg сообщения.
Если параметр log_level не указан, по умолчанию используется error .
По умолчанию директива error_log определена в директиве http внутри основного файла nginx.conf:
/etc/nginx/nginx.conf
http {
  ...
  error_log  /var/log/nginx/error.log;
  ...
}
Как и в случае с журналами доступа, рекомендуется создать отдельный файл журнала ошибок для каждого блока сервера, который переопределяет настройку, унаследованную от более высоких уровней.
Например, чтобы настроить журнал ошибок domain.com на warn вы должны использовать:
http {
  ...
  error_log  /var/log/nginx/error.log;
  ...

  server {
    server_name domain.com
    error_log  /var/log/nginx/domain.error.log warn;
    ...
  }
}
Каждый раз, когда вы изменяете файл конфигурации, вам необходимо перезапустить службу Nginx, чтобы изменения вступили в силу.
Расположение файлов журнала
По умолчанию в большинстве дистрибутивов Linux, таких как Ubuntu , CentOS и Debian , журналы доступа и ошибок расположены в каталоге /var/log/nginx .
Чтение и понимание файлов журнала Nginx
Вы можете открывать и анализировать файлы журнала, используя стандартные команды, такие как cat , less , grep , cut , awk и т. Д.
Вот пример записи из файла журнала доступа, в котором используется стандартный формат журнала Nginx для объединения:
192.168.33.1 - - [15/Oct/2019:19:41:46 +0000] "GET / HTTP/1.1" 200 396 "-" "Mozilla/5.0 (X11; Linux x86_64) AppleWebKit/537.36 (KHTML, like Gecko) Chrome/77.0.3865.120 Safari/537.36"
Давайте разберемся, что означает каждое поле записи:
$remote_addr—192.168.33.1— IP-адрес клиента, выполняющего запрос.-
$remote_user—-— Пользователь,$remote_userаутентификацию по HTTP. Если имя пользователя не задано, в этом поле отображается-. -
[$time_local]—[15/Oct/2019:19:41:46 +0000]— Время на локальном сервере. -
"$request"—"GET / HTTP/1.1"— тип запроса, путь и протокол. -
$status—200— Код ответа сервера. -
$body_bytes_sent—396— Размер ответа сервера в байтах. -
"$http_referer"—"-"— URL перехода. -
"$http_user_agent"—Mozilla/5.0 ...— Пользовательский агент клиента (веб-браузер).
Используйте команду tail для просмотра файла журнала в режиме реального времени:
tail -f access.log Выводы
Файлы журналов содержат полезную информацию о проблемах с сервером и о том, как посетители взаимодействуют с вашим сайтом.
Nginx позволяет настроить журналы доступа и ошибок в соответствии с вашими потребностями.
Если у вас есть какие-либо вопросы или отзывы, не стесняйтесь оставлять комментарии.
NGINX is one of the most widely used reverse proxy servers, web servers, and load balancers. It has capabilities like TLS offloading, can do health checks for backends, and offers support for HTTP2, gRPC, WebSocket, and most TCP-based protocols.
When running a tool like NGINX, which generally sits in front of your applications, it’s important to understand how to debug issues. And because you need to see the logs, you have to understand the different NGINX logging mechanisms. In addition to the errors in your application or web server, you need to look into NGINX performance issues, as they can lead to SLA breaches, negative user experience, and more.
In this article, we’ll explore the types of logs that NGINX provides and how to properly configure them to make troubleshooting easier.
What Are NGINX Logs?
NGINX logs are the files that contain information related to the tasks performed by the NGINX server, such as who tried to access which resources and whether there were any errors or issues that occured.
NGINX provides two types of logs: access logs and error logs. Before we show you how to configure them, let’s look at the possible log types and different log levels.
Here is the most basic NGINX configuration:
http{
    server {
        listen       80;
        server_name  example.com www.example.com;
        access_log   /var/log/nginx/access.log  combined;
        root         /var/www/virtual/big.server.com/htdocs;
    }
}
For this server, we opened port 80. The server name is “example.com www.example.com.” You can see the access and error log configurations, as well as the root of the directive, which defines from where to serve the files.
What Are NGINX Access Logs?
NGINX access logs are files that have the information of all the resources that a client is accessing on the NGINX server, such as details about what is being accessed and how it responded to the requests, including client IP address, response status code, user agent, and more. All requests sent to NGINX are logged into NGINX logs just after the requests are processed.
Here are some important NGINX access log fields you should be aware of:
- remote_addr: The IP address of the client that requested the resource
- http_user_agent: The user agent in use that sent the request
- time_local: The local time zone of the server
- request: What resource was requested by the client (an API path or any file)
- status: The status code of the response
- body_bytes_sent: The size of the response in bytes
- request_time: The total time spent processing the request
- remote_user: Information about the user making the request
- http_referer: The IP address of the HTTP referer
- gzip_ratio: The compression ratio of gzip, if gzip is enabled
NGINX Access Log Location
You can find the access logs in the logs/access.log file and change their location by using the access_log directive in the NGINX configuration file.
access_log path [format [buffer=size] [gzip[=level]] [flush=time] [if=condition]];
access_log /var/log/nginx/access.log combined
By changing the path field in the access_log directive, you can also change where you want to save your access logs.
An NGINX access log configuration can be overridden by another configuration at a lower level. For example:
http {
  access_log  /var/log/nginx/access.log  main;
  server {
    listen 8000;
    location /health {
      access_log off; # <----- this WILL work
      proxy_pass http://app1server;
    }
  }
}
Here, any calls to /health will not be logged, as the access logs are disabled for this path. All the other calls will be logged to the access log. There is a global config, as well as different local configs. The same goes for the other configurations that are in the NGINX config files.
How to Enable NGINX Access Logs
Most of the time, NGINX access logs are enabled by default. To enable them manually, you can use the access_log directive as follows:
access_log /var/log/nginx/access.log combined
The first parameter is the location of the file, and the second is the log format. If you put the access_log directive in any of the server directories, it will start the access logging.
Setting Up NGINX Custom Log Format
To easily predefine the NGINX access log format and use it along with the access_log directive, use the log_format directive:
log_format upstream_time '$remote_addr - $remote_user [$time_local] '
    '"$request" $status $body_bytes_sent '
    '"$http_referer" "$http_user_agent"'
    'rt=$request_time uct="$upstream_connect_time" uht="$upstream_header_time" urt="$upstream_response_time"';
Most of the fields here are self explanatory, but if you want to learn more, look up NGINX configurations for logging. You can specify the log formats in an HTTP context in the /etc/nginx/nginx.conf file and then use them in a server context.
By default, NGINX access logs are written in a combined format, which looks something like this:
log_format combined '$remote_addr - $remote_user [$time_local] '
                    '"$request" $status $body_bytes_sent '
                    '"$http_referer" "$http_user_agent"';
Once you have defined the log formats, you can use them with the access_log directive, like in the following examples:
server {
    access_log /var/log/nginx/access.log combined
    access_log /var/log/nginx/access.log upstream_time #defined in the first format
    …
}
Formatting the Logs as JSON
Logging to JSON is useful when you want to ship the NGINX logs, as JSON makes log parsing very easy. Since you have key-value information, it will be simpler for the consumer to understand. Otherwise, the parse has to understand the format NGINX is logging.
NGINX 1.11.8 comes with an escape=json setting, which helps you define the NGINX JSON log format. For example:
log_format json_combined escape=json
  '{'
    '"time_local":"$time_local",'
    '"remote_addr":"$remote_addr",'
    '"remote_user":"$remote_user",'
    '"request":"$request",'
    '"status": "$status",'
    '"body_bytes_sent":"$body_bytes_sent",'
    '"http_referrer":"$http_referer",'
    '"http_user_agent":"$http_user_agent",'
    '"request_time":"$request_time"'
  '}';
You can now use this predefined log format in JSON with the access_log directive to get the logs in JSON.
You can also use an open-source NGINX module, like https://github.com/jiaz/nginx-http-json-log, to do the JSON logging.
Configuring NGINX Conditional Logging
Sometimes, you want to write logs only when a certain condition is met. NGINX calls this conditional logging. For example:
map $remote_addr $log_enable {
    "192.168.4.1" 0;
    "192.168.4.2" 0;
    "192.168.4.3" 0;
    "192.168.4.4" 0;
    default 1;
}
access_log /var/log/nginx/access.log combined if=$log_enable
This means that whenever the request comes from the IPs 192.168.4.1 to 192.168.4.4, the access logs will not be populated. For every other IP, the logs will be recorded.
You can use conditional logging with NGINX in multiple scenarios. For example, if you are under attack and can identify the IPs of the attacker, you can log the requests to a different file. This allows you to process the file and get relevant information about the attack later.
How to View NGINX Access Logs
Linux utilities, like LESS or TAIL, allow you to view NGINX logs easily. You can also see the NGINX access logs’ location from the configuration files. With newer systems that are running systemd, the journalctl feature can tail the logs. To see the logs, use this command:
journalctl -fu nginx.service
You can also tail the log locations, as shown here:
tail -f /var/log/nginx/access.log
It’s also possible to use journalctl, but this will show all the logs together, which can be a bit confusing.
How to Disable Access Logs
To disable an NGINX access log, pass the off argument to the access_log directive:
access_log off;
This can be useful when there are too many logs, which can overload the disk IO and, in rare cases, impact the performance of your NGINX server. However, disabling NGINX access logs is not usually recommended, as it can make troubleshooting difficult.
What Are NGINX Error Logs?
NGINX error logs are the files where all information about errors will be logged, including permission errors or any NGINX configuration-related access errors. While access logs are used to see the HTTP requests received by the server, error logs bring more value, as when there is an issue, they will show exactly what happened and provide detailed information about the issue.
Whenever there is an error with the requests, or when there are NGINX glitches, these issues will be recorded in the error log files configured in the NGINX configuration file.
Where Are the NGINX Error Logs Stored?
The location of NGINX error logs can be configured in the error_log directive in the NGINX configuration. By default, these logs are in the /var/log/nginx directory. You can configure the location separately for different server components that you can run in the NGINX configuration.
The default location is:
/var/log/nginx/error.log
NGINX Error Logs Configuration
NGINX error logs configuration is in the same place as access_log. You can use the error_log directive to enable and configure the log levels and the location of the log file. Here is the configuration line to enable the error_log:
error_log log_file_location log_level;
NGINX Error Log Levels
NGINX has eight log levels for different degrees of severity and verbosity:
- emerg: These are the emergency logs. They mean that the system is unusable.
- alert: An immediate action is required.
- crit: A critical condition occurred.
- error: An error or failure occurred while processing a request.
- warn: There was an unexpected event, or something needs to be fixed, but NGINX fulfilled the request as expected.
- notice: Something normal, but important, has happened, and it needs to be noted.
- info: These are messages that give you information about the process.
- debug: These are messages that help with debugging and troubleshooting. They are generally not enabled unless needed because they create a lot of noise.
Note that the log_level parameter is a threshold, as every log level includes the previous log levels as well. For example, if your log level is 6 (notice), your logs will contain entries from levels 1 through 6.
Enable Debug Logging and Other Levels
You can specify the log level with the error_log directive using the log_level argument. As the log level number increases, the logs will contain more information. If the application misbehaves, you can enable the debug logs to aid you in the troubleshooting process. With the extra information they provide, you will be able to pinpoint the issue more easily. You can read about this more in the NGINX documentation.
Keeping NGINX debug logs enabled continuously is not recommended, as it will make logs very noisy and large by printing information that is generally unnecessary. If you see an issue, you can change the log level on the fly, solve the problem, then revert it back to a stricter severity.
Logging to Multiple Files
You can forward NGINX error logs to separate files based on the different log levels. In the configuration below, you send logs to all the specified log directives based on the log severity level.
error_log /var/log/nginx/error.info info;
error_log /var/log/nginx/error.crit crit;
This configuration can be very useful when looking at the different log levels separately or if you want your logging agent to label these logs based on filenames. You can selectively discard the error logs based on their severity.
How to Check NGINX Error Logs
You can view NGINX error logs the same way as access logs: for example, by using TAIL, LESS, or other utilities. Below is an example of how to do it with TAIL using the location of the error_logs that you have set. These logs are also present in journalctl logs, but there, they will be a combination of access_log and error_logs.
tail -f /var/log/nginx/error.log
How to Disable Error Logs
Disabling NGINX error logs can be tricky, as there is no off option in error_log. Similar to access_log in the lower configuration levels, you can use error_log false at the higher level configurations.
error_log off;
For the lower levels, you can forward the logs to /dev/null:
error_log /dev/null;
How to Send NGINX Logs to Syslog
NGINX can also ship your logs to log aggregators using syslog. This can be useful when you are logging other system/service logs in syslog or using syslog to export the logs. You can implement this with the syslog: prefix, which can be used with both access_log and error_logs. You can also use this prefix instead of the file path in the access_log and error_log directives.
Syslog can help you concentrate your NGINX logs in one place by forwarding them to a centralized logging solution:
error_log syslog:unix/var/log/nginx.sock debug
You can also send the logs to different syslog servers by defining the syslog server parameter to point to the IP or hostname and port of the syslog server.
error_log syslog:server=192.168.100.1 debug
access_log syslog:server=[127.0.0.1]:9992, facility=local1,tag=nginx,severity=debug;
In the above configuration for access_log, the logs are forwarded to the local syslog server, with the service name as local1, since syslog doesn’t have an option for NGINX.
Syslog has various options for keeping the forwarded logs segregated:
- Facility: Identifies who is logging to syslog.
- Severity: Specifies the log levels.
- Tag: Identifies the message sender or any other information that you want to send; default is NGINX.
NGINX Logging in Kubernetes Environments
In Kubernetes, NGINX Ingress runs as a pod. All the logs for the NGINX Ingress pods are sent to standard output and error logs. However, if you want to see the logs, you have to log in to the pod or use the kubectl commands, which is not a very practical solution.
You also have to find a way to ship the logs from the containers. You can do this with any logging agent that is running in the Kubernetes environment. These agents run as pods and mount the file system that NGINX runs on, reading the logs from there.
How to See the NGINX Ingress Logs
Use the kubectl logs command to see the NGINX logs as streams:
$ kubectl logs -f nginx-ingress-pod-name -n namespace.
It’s important to understand that pods can come and go, so the approach to debugging issues in the Kubernetes environment is a bit different than in VM or baremetal-based environments. In Kubernetes, the logging agent should be able to discover the NGINX Ingress pods, then scrape the logs from there. Also, the log aggregator should show the logs of the pods that were killed and discover any new pod that comes online.
NGINX Logging and Analysis with Sematext
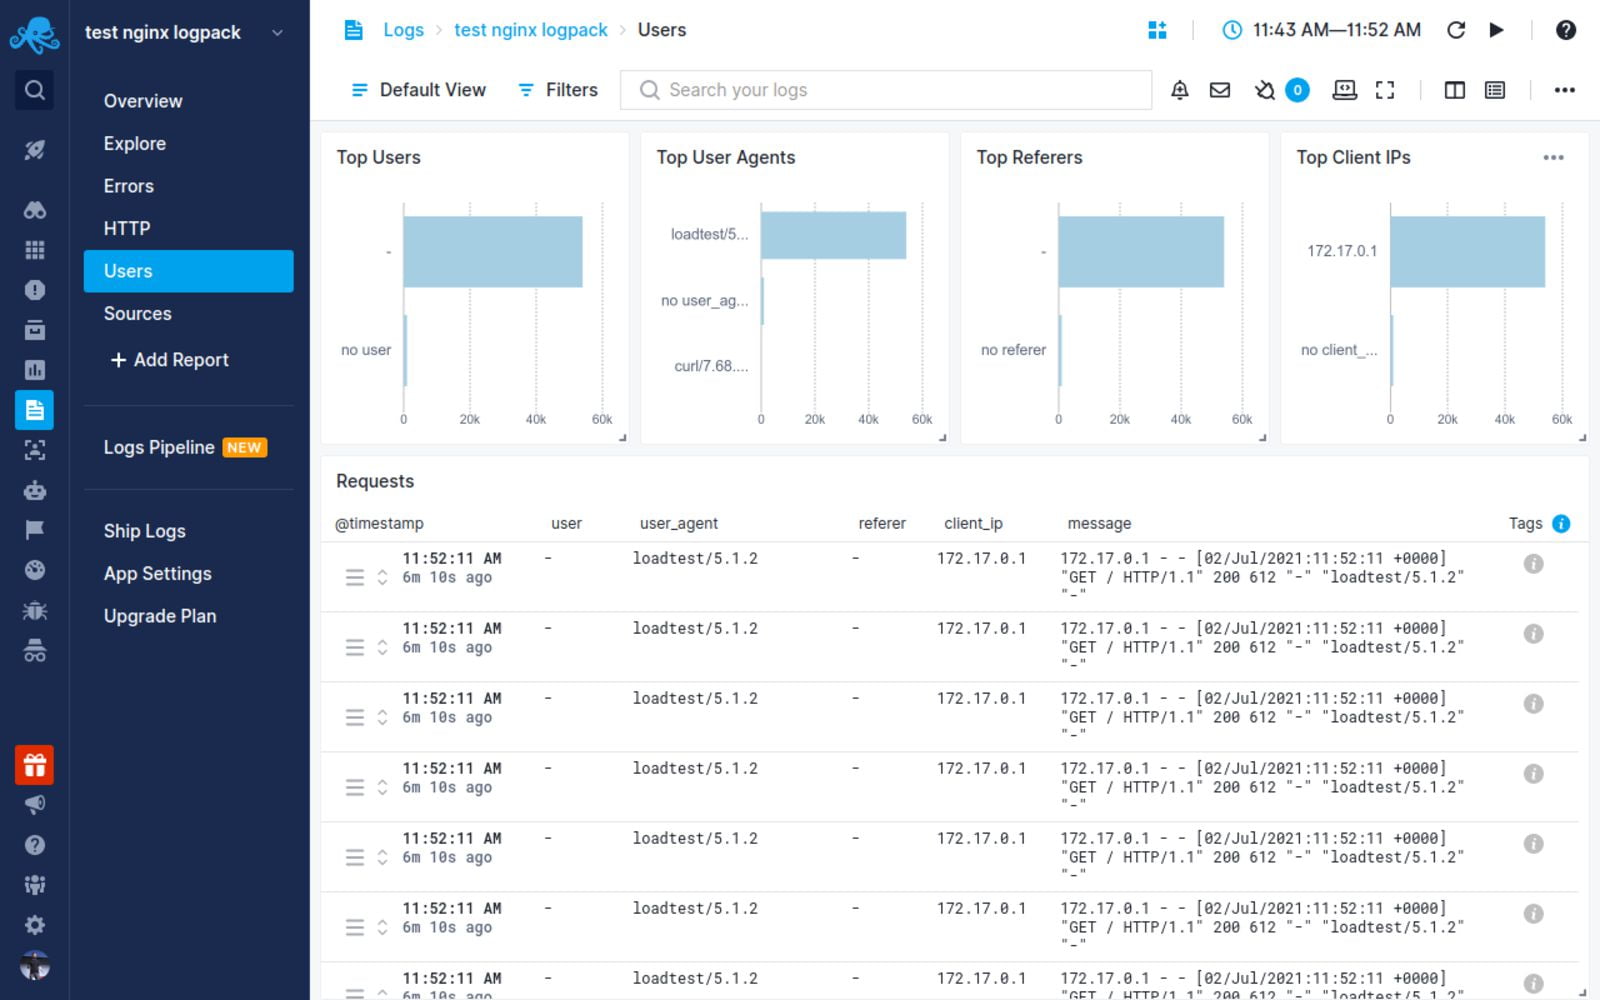
NGINX log integration with Sematext
Sematext Logs is a log aggregation and management tool with great support for NGINX logs. Its auto-discovery feature is helpful, particularly when you have multiple machines. Simply create an account with Sematext, create the NGINX Logs App and install the Sematext Agent. Once you’re set up, you get pre-built, out-of-the-box dashboards and the option to build your own custom dashboards.
Sematext Logs is part of Sematext Cloud, a full-stack monitoring solution that gives you all you need when it comes to observability. By correlating NGINX logs and metrics, you’ll get a more holistic view of your infrastructure, which helps you identify and solve issues quickly.
Using anomaly-detection algorithms, Sematext Cloud informs you in advance of any potential issues. These insights into your infrastructure help you prevent issues and troubleshoot more efficiently. With Sematext Cloud, you can also collect logs and metrics from a wide variety of tools, including HAProxy, Apache Tomcat, JVM, and Kubernetes. By integrating with other components of your infrastructure, this tool is a one-stop solution for all your logging and monitoring needs.
If you’d like to learn more about Sematext Logs, and how they can help you manage your NGINX logs, then check out this short video below:
If you’re interested in how Sematext compares to other log management tools, read our review of the top NGINX log analyzers.
Conclusion
Managing, troubleshooting, and debugging large-scale NGINX infrastructures can be challenging, especially if you don’t have a proper way of looking into logs and metrics. It’s important to understand NGINX access and error logs, but if you have hundreds of machines, this will take a substantial amount of time. You need to be able to see the logs aggregated in one place.
Performance issues are also more common than you think. For example, you may not see anything in the error logs, but your APIs continue to degrade. To look into this properly, you need effective dashboarding around NGINX performance metrics, like response code and response time.
Sematext Logs can help you tackle these problems so you can troubleshoot more quickly. Sign up for our free trial today.
Author Bio

Gaurav Yadav
Gaurav has been involved with systems and infrastructure for almost 6 years now. He has expertise in designing underlying infrastructure and observability for large-scale software. He has worked on Docker, Kubernetes, Prometheus, Mesos, Marathon, Redis, Chef, and many more infrastructure tools. He is currently working on Kubernetes operators for running and monitoring stateful services on Kubernetes. He also likes to write about and guide people in DevOps and SRE space through his initiatives Learnsteps and Letusdevops.
(britespanbuildings)
Файлы логов — первое место, где нужно искать ошибки. Особенно если это касается веб-сервера. В Nginx всего два основных лога: error_log и access_log.
Помогаем

Лог ошибок error_log
Логирование ошибок Nginx происходит в определенный файл, stderr или syslog. Он собирает все ошибки, которые произошли во время работы веб-сервера. По умолчанию он включен глобально:
error_log logs/error.log error;
Записываются только ошибки в файл по указанному пути
Для сбора только определенных ошибок необходимо разместить директиву в секции http, server, stream или location. А так можно логировать только критические ошибки и сигналы тревоги:
error_log logs/error.log warn;
Записываются ошибки уровня warn, error crit, alert, emerg
Курс
МЕНЕДЖЕР ПО РОБОТІ З КЛІЄНТАМИ
Ставайте затребуваним фахівцем та отримуйте свій офер мрії.
РЕЄСТРУЙТЕСЯ!

Лог доступа access_log
Лог доступа Nginx по умолчанию размещен в директории logs/access.log. В него записываются данные о запросах пользователей, как только эти запросы обработаны. Для изменения директории расположения лога используется директива access_log:
access_log logs/access.log combined;
Используется комбинированный формат
В расширенном виде access_log можно настроить по своим требованиям:
http {

log_format compression '$remote_addr - $remote_user [$time_local] '
'"$request" $status $body_bytes_sent '
'"$http_referer" "$http_user_agent" "$gzip_ratio"';
server {
gzip on;
access_log /spool/logs/nginx-access.log compression;
...
}

}
Задается пользовательский формат с записью времени подключения, TTFB, TTLB, времени обработки запроса
Также можно исключить ненужную информацию из лога:
map $status $loggable {
~^[23] 0;
default 1;
}
access_log /path/to/access.log combined if=$loggable;
Исключает запросы к HTTP со статусом 2ХХ (успешно) и 3ХХ (редирект)
Запись в syslog
Стандартная для UNIX-систем утилита syslog может собирать логи и различные сообщения разных процессов на одном сервере:
access_log syslog:server=[2001:db8::1]:1234,facility=local7,tag=nginx,severity=info;
Перенаправляет информацию в syslog
Директива server указывает адрес сервера (здесь IPv6) и порт. А facility — специфические параметры программы: auth, authpriv, daemon, cron, ftp, lpr, kern, mail, news, syslog,user, uucp, local0 … local7.
Включение режима debug
При необходимости можно включить Nginx debug-режим записи логов, который обеспечивает расширенную информацию и полезен при решении серьезных проблем:
error_log logs/error.log debug;
Можно включить только для нужной секции или отдельных клиентов соединений
Этот текст был написан несколько лет назад. С тех пор упомянутые здесь инструменты и софт могли получить обновления. Пожалуйста, проверяйте их актуальность.
14 января, 2018 11:59 дп
6 574 views
| Комментариев нет
Linux, VPS
Nginx – это свободный и открытый веб-сервер, который используется для обслуживания сайтов и приложений любой сложности. Nginx известен своим низким воздействием на память, высокой масштабируемостью и модульной, управляемой событиями архитектурой, которая может обеспечить надежную и предсказуемую производительность. Nginx работает не только как веб-сервер, но и как балансировщик нагрузки, кэширующий HTTP-сервер и обратный прокси-сервер.
Конечно, сначала может быть сложно запомнить все команды и рекомендации по управлению сервером Nginx. Это руководство предназначено для тех, кто работает с Nginx. Оно охватывает некоторые основные команды управления сервисами, а также советы по диагностике и решению некоторых распространенных проблем.
Каждый раздел может использоваться независимо от других, поэтому вы можете пропустить разделы, которые вам не нужны. Все условные значения в командах выделены красным; вместо этих значений вы можете подставить свои данные.
Каждый раздел предлагает ссылки на другие руководства, с которыми можно проконсультироваться.
Примечание: Предполагается, что вы работаете с версией Nginx, установленной из репозитория по умолчанию в Debian-подобном дистрибутиве. Некоторые из команд и директив, описанных в этом руководстве, отсутствуют в других дистрибутивах или в версиях Nginx, установленных из других источников.
Установка Nginx
Обновите индекс пакетов, а затем установите Nginx:
sudo apt-get update

sudo apt-get install nginx
Читайте также: Установка Nginx в Ubuntu 16.04
Проверка состояния Nginx
Чтобы проверить состояние веб-сервера на текущей машине, введите:
sudo systemctl status nginx
Автозагрузка Nginx
По умолчанию сервис Nginx запускается автоматически. Если вы хотите изменить это поведение, введите:
sudo systemctl disable nginx
Чтобы снова добавить Nginx в автозагрузку, введите:
sudo systemctl enable nginx
Управление сервисом Nginx
Чтобы остановить сервер Nginx, введите следующую команду:
sudo systemctl stop nginx
Чтобы запустить сервер Nginx, введите:
sudo systemctl start nginx
Чтобы остановить сервис и запустить его снова, введите:
sudo systemctl restart nginx
Если вы изменили конфигурацию, вы можете перезагрузить Nginx в текущей сессии. Введите следующую команду:
sudo systemctl reload nginx
Читайте также: Основы Systemd: управление сервисами и журналирование
Создание корневого каталога для статического контента
При создании сайтов на Nginx разработчики часто используют виртуальные хосты (или блоки server) – это хосты, которые обслуживают отдельные сайты или домены. Для этого нужно создать document root, каталог верхнего уровня, который Nginx проверяет при обслуживании контента.
Команды в приведенном ниже блоке создадут новый корневой каталог, передадут права на него пользователю sudo и изменят права доступа к каждому подкаталогу в подкаталога в /var/www/.
sudo mkdir -p /var/www/example.com/html

sudo chown -R $USER:$USER /var/www/example.com/html

find /var/www -type d -exec chmod 775 {} ;
В данном случае корневой каталог предлагает глобальные права на чтение и исполнение. Чтобы выбрать другие права доступа, замените 775 и укажите требуемые права.
Читайте также: Привилегии в Linux: что это и как с этим работать
Помните, что права доступа должны меняться в соответствии с ситуацией.
Создание корневого каталога для динамических файлов
Если ваш сайт использует динамические модули типа PHP-FPM, вам может понадобиться передать права на некоторые файлы группе www-data. Если группе нужно право на запись в каталоге, передайте группе права собственности на каталог.
Предложенные ниже команды создают новый document root, передают его группе www-data и изменяют права на каждый подкаталог в /var/www.
sudo mkdir -p /var/www/example.com/html

sudo chown -R www-data:www-data /var/www/example.com

sudo find /var/www -type d -exec chmod 775 {} ;
Читайте также: Настройка виртуальных хостов Nginx в Ubuntu 16.04
Включение и отключение конфигурационных файлов
Чтобы включить виртуальный хост, нужно создать симлинк из каталога sites-available в каталог sites-enabled, который Nginx читает во время запуска.
Для этого введите комнаду:
sudo ln -s /etc/nginx/sites-available/example.com /etc/nginx/sites-enabled/
После этого нужно перезагрузить Nginx, чтобы настройки обновились.
Устранение неполадок с хэш-таблицей
Nginx использует хэш-таблицы, чтобы быстро обрабатывать статические данные (имена серверов, MIME-типы). Если вы добавили несколько имен серверов, есть вероятность, что заданного размера хэша имени сервера будет не хватать, и при внесении изменений вы увидите ошибку server_names_hash_bucket_size. Ее можно устранить, отредактировав одно значение в файле /etc/nginx/nginx.conf.
Откройте этот файл:
sudo nano /etc/nginx/nginx.conf
Найдите в файле директиву server_names_hash_bucket_size. Удалите символ #, чтобы раскомментировать строку, и увеличьте значение директивы:
http {

. . .

server_names_hash_bucket_size 64;

. . .

}
Это увеличит размер хэш-таблиц имен серверов Nginx и позволит сервису обрабатывать все имена серверов, которые вы добавили. Сохраните и закройте файл, а затем перезапустите Nginx, чтобы обновить настройки.
Тестирование конфигурации
Каждый раз, когда вы вносите изменения в конфигурационные файлы Nginx, обязательно выполните следующую команду, чтобы проверить наличие синтаксических ошибок:
sudo nginx -t
Если в конфигурации есть ошибки, вывод команды укажет, где именно они обнаружены. Если же в конфигурационных файлах нет синтаксических ошибок, вы увидите примерно такой вывод:
nginx: the configuration file /etc/nginx/nginx.conf syntax is ok

nginx: configuration file /etc/nginx/nginx.conf test is successful
Если ошибок нет, вы можете перезагрузить сервис:
sudo systemctl restart nginx
Важные файлы и каталоги Nginx
Контент
Каталог /var/www/html хранит весь контент сайта (это корневой каталог сайта). Вы можете изменить стандартные настройки Nginx и указать другие каталоги в var/www.
Конфигурация сервера
- /etc/nginx/: конфигурационный каталог Nginx (здесь хранятся все конфигурационные файлы веб-сервера).
- /etc/nginx/nginx.conf: главный конфигурационный файл веб-сервера, в котором находятся все глобальные параметры.
- /etc/nginx/sites-available/default: виртуальный хост Nginx по умолчанию. Другие виртуальные хосты также должны храниться в каталоге sites-available (но они не будут работать без симлинка в sites-enabled).
- /etc/nginx/sites-enabled/: здесь хранятся файлы включенных виртуальных хостов. При запуске или перезагрузке Nginx читает конфигурационные файлы и ссылки в этом каталоге, чтобы собрать полную конфигурацию.
Логи
- /var/log/nginx/access.log: это лог, который регистрирует все запросы Nginx (если в конфигурации веб-сервера не сказано другого).
- /var/log/nginx/error.log: это лог ошибок.
Чтобы получить доступ к логам systemd процесса Nginx, запустите эту команду:
sudo journalctl -u nginx
Заключение
Данный мануал перечислил общие процедуры по поддержке сервера Nginx. Чтобы узнать больше о работе с Nginx, ознакомьтесь со следующими руководствами:
- Оптимизация настроек Nginx
- Алгоритмы выбора блоков server и location в Nginx
Tags: NGINX
I’m using Django with FastCGI + nginx. Where are the logs (errors) stored in this case?

asked Nov 10, 2009 at 7:09

Errors are stored in the nginx log file. You can specify it in the root of the nginx configuration file:
error_log /var/log/nginx/nginx_error.log warn;
On Mac OS X with Homebrew, the log file was found by default at the following location:
/usr/local/var/log/nginx
answered Nov 10, 2009 at 11:30

syavasyava
5,7481 gold badge16 silver badges2 bronze badges
3
I was looking for a different solution.
Error logs, by default, before any configuration is set, on my system (x86 Arch Linux), was found in:
/var/log/nginx/error.log
answered Sep 1, 2013 at 9:10

BenBen
53.4k48 gold badges176 silver badges223 bronze badges
2
You can use lsof (list of open files) in most cases to find open log files without knowing the configuration.
Example:
Find the PID of httpd (the same concept applies for nginx and other programs):
$ ps aux | grep httpd
...
root     17970  0.0  0.3 495964 64388 ?        Ssl  Oct29   3:45 /usr/sbin/httpd
...
Then search for open log files using lsof with the PID:
$ lsof -p 17970 | grep log
httpd   17970 root    2w   REG             253,15     2278      6723 /var/log/httpd/error_log
httpd   17970 root   12w   REG             253,15        0      1387 /var/log/httpd/access_log
If lsof prints nothing, even though you expected the log files to be found, issue the same command using sudo.
You can read a little more here.
answered Dec 10, 2014 at 16:06
5
Run this command, to check error logs:
tail -f /var/log/nginx/error.log

ndmeiri
4,92812 gold badges35 silver badges44 bronze badges
answered Oct 5, 2015 at 15:37

Taimoor ChangaizTaimoor Changaiz
10k4 gold badges48 silver badges53 bronze badges
My ngninx logs are located here:
/usr/local/var/log/nginx/*
You can also check your nginx.conf to see if you have any directives dumping to custom log.
run nginx -t to locate your nginx.conf.
# in ngingx.conf
error_log  /usr/local/var/log/nginx/error.log;
error_log  /usr/local/var/log/nginx/error.log  notice;
error_log  /usr/local/var/log/nginx/error.log  info;
Nginx is usually set up in /usr/local or /etc/. The server could be configured to dump logs to /var/log as well.
If you have an alternate location for your nginx install and all else fails, you could use the find command to locate your file of choice.
find /usr/ -path "*/nginx/*" -type f -name '*.log', where /usr/ is the folder you wish to start searching from.
answered Dec 10, 2014 at 13:44

lfender6445lfender6445
32k11 gold badges117 silver badges98 bronze badges
1
Logs location on Linux servers:
Apache – /var/log/httpd/

IIS – C:inetpubwwwroot

Node.js – /var/log/nodejs/

nginx – /var/log/nginx/

Passenger – /var/app/support/logs/

Puma – /var/log/puma/

Python – /opt/python/log/

Tomcat – /var/log/tomcat8
answered Sep 6, 2018 at 12:34
Syed ShibliSyed Shibli
9721 gold badge12 silver badges15 bronze badges
Type this command in the terminal:
sudo cat /var/log/nginx/error.log
answered Jan 4, 2018 at 6:05

priyashapriyasha
4675 silver badges4 bronze badges
1
For Mac OS users, you can type nginx -help in your terminal.
nginx version: nginx/1.21.0
Usage: nginx [-?hvVtTq] [-s signal] [-p prefix]
             [-e filename] [-c filename] [-g directives]

Options:
  -?,-h         : this help
  -v            : show version and exit
  -V            : show version and configure options then exit
  -t            : test configuration and exit
  -T            : test configuration, dump it and exit
  -q            : suppress non-error messages during configuration testing
  -s signal     : send signal to a master process: stop, quit, reopen, reload
  -p prefix     : set prefix path (default: /opt/homebrew/Cellar/nginx/1.21.0/)
  -e filename   : set error log file (default: /opt/homebrew/var/log/nginx/error.log)
  -c filename   : set configuration file (default: /opt/homebrew/etc/nginx/nginx.conf)
  -g directives : set global directives out of configuration file
Then, you could find some default path for configuration and log files, in this case:
/opt/homebrew/log/nginx/error.log
answered Jun 26, 2021 at 3:48

minglyuminglyu
2,8352 gold badges12 silver badges31 bronze badges
cd /var/log/nginx/
cat error.log

answered Jun 9, 2015 at 6:12

0
It is a good practice to set where the access log should be in nginx configuring file . Using acces_log /path/ Like this.
keyval $remote_addr:$http_user_agent $seen zone=clients;

server { listen 443 ssl;

ssl_protocols TLSv1 TLSv1.1 TLSv1.2;
ssl_ciphers   HIGH:!aNULL:!MD5;

if ($seen = "") {
    set $seen  1;
    set $logme 1;
}
access_log  /tmp/sslparams.log sslparams if=$logme;
error_log  /pathtolog/error.log;
# ...
}
answered Jan 6, 2021 at 11:48

I found it in /usr/local/nginx/logs/*.
answered Jul 16, 2019 at 11:36

mygeeamygeea
4693 silver badges9 bronze badges
2