Представление результатов исследования
В научных публикациях важно представление результатов исследования. Очень часто окончательный результат приводится в следующем виде: M±m, где M – среднее арифметическое, m –ошибка среднего арифметического. Например, 163,7±0,9 см.
Прежде чем разбираться в правилах представления результатов исследования, давайте точно усвоим, что же такое ошибка среднего арифметического.
Ошибка среднего арифметического
Среднее арифметическое, вычисленное на основе выборочных данных (выборочное среднее), как правило, не совпадает с генеральным средним (средним арифметическим генеральной совокупности). Экспериментально проверить это утверждение невозможно, потому что нам неизвестно генеральное среднее. Но если из одной и той же генеральной совокупности брать повторные выборки и вычислять среднее арифметическое, то окажется, что для разных выборок среднее арифметическое будет разным.
Чтобы оценить, насколько выборочное среднее арифметическое отличается от генерального среднего, вычисляется ошибка среднего арифметического или ошибка репрезентативности.
Ошибка среднего арифметического обозначается как m или 
Ошибка среднего арифметического рассчитывается по формуле:
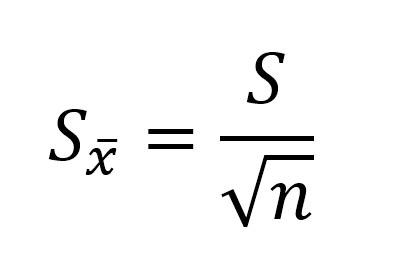
где: S — стандартное отклонение, n – объем выборки; Например, если стандартное отклонение равно S=5 см, объем выборки n=36 человек, то ошибка среднего арифметического равна: m=5/6 = 0,833.
Ошибка среднего арифметического показывает, какая ошибка в среднем допускается, если использовать вместо генерального среднего выборочное среднее.
Так как при небольшом объеме выборки истинное значение генерального среднего не может быть определено сколь угодно точно, поэтому при вычислении выборочного среднего арифметического нет смысла оставлять большое число значащих цифр.
Правила записи результатов исследования
- В записи ошибки среднего арифметического оставляем две значащие цифры, если первые цифры в ошибке «1» или «2».
- В остальных случаях в записи ошибки среднего арифметического оставляем одну значащую цифру.
- В записи среднего арифметического положение последней значащей цифры должно соответствовать положению первой значащей цифры в записи ошибки среднего арифметического.
Представление результатов научных исследований
В своей статье «Осторожно, статистика!», опубликованной в 1989 году В.М. Зациорский указал, какие числовые характеристики должны быть представлены в публикации, чтобы она имела научную ценность. Он писал, что исследователь «…должен назвать: 1) среднюю величину (или другой так называемый показатель положения); 2) среднее квадратическое отклонение (или другой показатель рассеяния) и 3) число испытуемых. Без них его публикация научной ценности иметь не будет “с. 52
В научных публикациях в области физической культуры и спорта очень часто окончательный результат приводится в виде: (М±m) (табл.1).
Таблица 1 — Изменение механических свойств латеральной широкой мышцы бедра под воздействием физической нагрузки (n=34)
| Эффективный модуль
упругости (Е), кПа |
Эффективный модуль
вязкости (V), Па с |
|||
| Этап
эксперимента |
Рассл. | Напряж. | Рассл. | Напряж. |
| До ФН | 7,0±0,3 | 17,1±1,4 | 29,7±1,7 | 46±4 |
| После ФН | 7,7±0,3 | 18,7±1,4 | 30,9±2,0 | 53±6 |
Литература
- Высшая математика и математическая статистика: учебное пособие для вузов / Под общ. ред. Г. И. Попова. – М. Физическая культура, 2007.– 368 с.
- Гласс Дж., Стэнли Дж. Статистические методы в педагогике и психологии. М.: Прогресс. 1976.- 495 с.
- Зациорский В.М. Осторожно — статистика! // Теория и практика физической культуры, 1989.- №2.
- Катранов А.Г. Компьютерная обработка данных экспериментальных исследований: Учебное пособие/ А. Г. Катранов, А. В. Самсонова; СПб ГУФК им. П.Ф. Лесгафта. – СПб.: изд-во СПб ГУФК им. П.Ф. Лесгафта, 2005. – 131 с.
- Основы математической статистики: Учебное пособие для ин-тов физ. культ / Под ред. В.С. Иванова.– М.: Физкультура и спорт, 1990. 176 с.
Чтобы
судить о том, насколько точно проведенные
измерения отражают состав генеральной
совокупности, необходимо вычислить
стандартную ошибку средней арифметической
выборочной совокупности.
Стандартная
ошибка средней арифметической
характеризует степень отклонения
выборочной средней арифметической от
средней арифметической генеральной
совокупности.
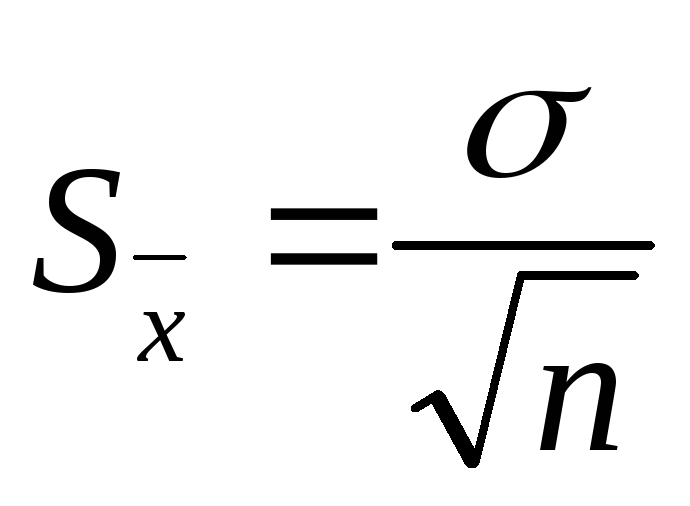
Стандартная
ошибка средней арифметической вычисляется
по формуле:
 ,
,
где
– стандартное отклонение результатов
измерений, n
– объем выборки.
Зачастую
мы имеем дело с одной случайной выборкой
и с одной полученной при ее обработке
выборочной средней. Задача заключается
в суждении о величине неизвестной
генеральной средней по полученной
неточной величине случайной выборочной
средней.
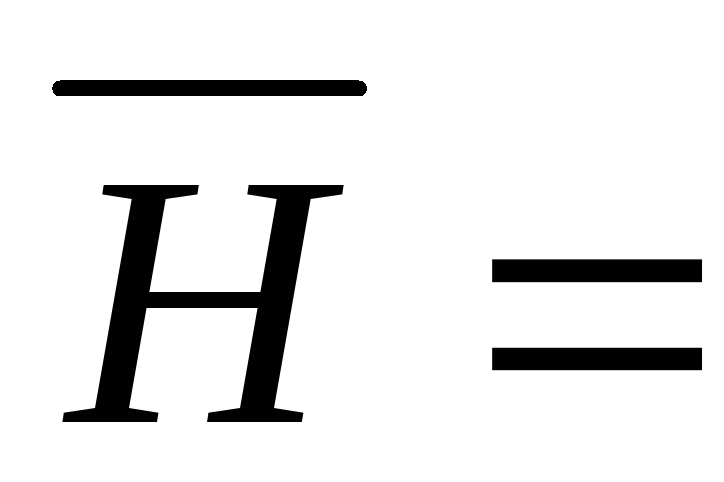
Вычислим
среднюю ошибку найденного выборочного
среднего значения роста:
 195
195
см; σ = 8,8 см;
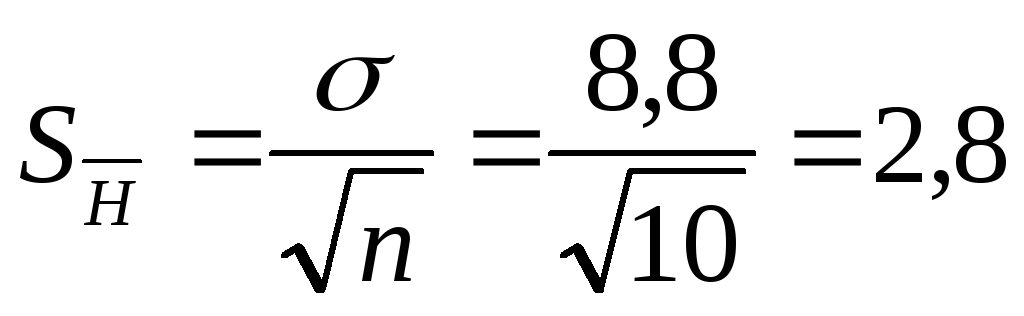 см.
см.
2,8 см
составляют не максимальную, а среднюю
возможную ошибку среднего. Отдельные
выборочные средние могут отклоняться
от генеральной как больше, так и меньше,
чем на 2,8 см.
Каковы
же пределы возможных ошибок случайной
выборки, какова ее максимальная ошибка?
Величина максимальной ошибки зависит
от величины средней ошибки и вычисляется
по формуле
 .
.
При
объеме выборки n
= 10:
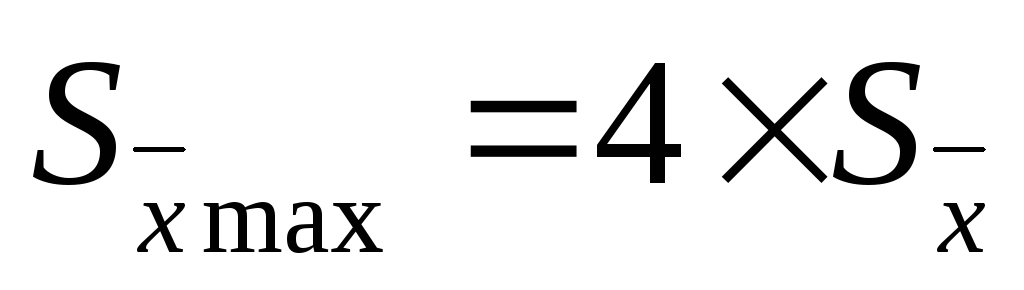 .
.
Все
случайные выборочные средние, которые
могут быть получены в подобных опытах
(в том числе и фактически полученная
выборочная средняя
 = 195 см), при своем варьировании около
неизвестного генерального среднего в
подавляющем количестве группируются
около него так, что лишь ничтожный
процент их отклоняется от генеральной
средней более, чем на величину максимальной
ошибки.
Другими
словами, генеральная средняя определяется
как
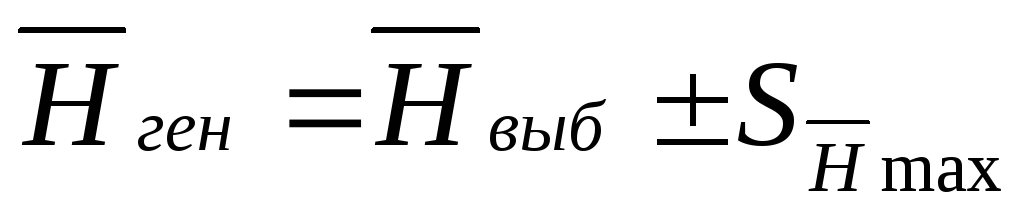 .
.
Эти пределы
колебаний значительно сужаются, если
средняя ошибка уменьшается благодаря
увеличению численности выборки.
Искомая
генеральная средняя лежит между
 и
и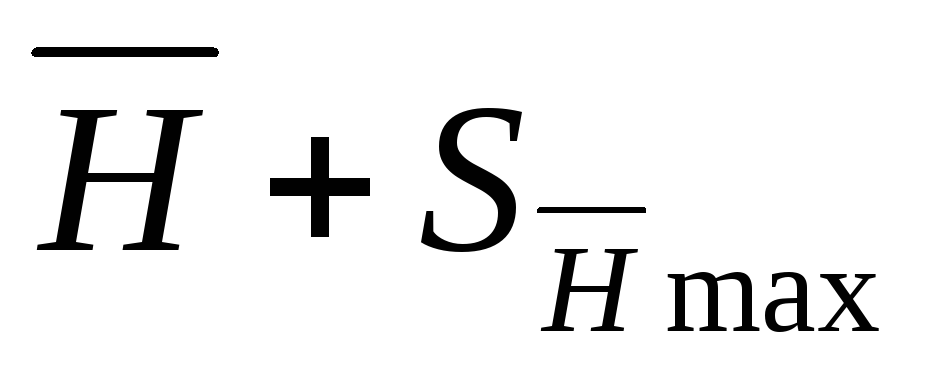 .
.
Таким образом, при высокой точности
выполнения эксперимента и достаточно
большом числе измерений можно определить
среднюю арифметическую бесконечно
большого числа экспериментов.
До сих
пор мы определяли максимальную ошибку
выборочной средней, исходя из того, что
все остальные показатели известны. Если
же мы хотим достичь определенной
точности, определенного приближения к
генеральной средней, в этом случае
встает вопрос о численности выборки (о
том, сколько измерений, опытов необходимо
провести).
Допустим, что
максимальная ошибка должна быть равна
5 см. Сколько человек надо обследовать
(измерить) в нашем случае?
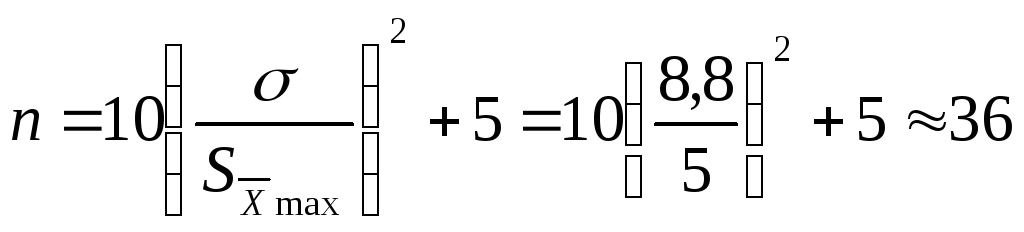 .
.
Следовательно,
мы должны провести измерения роста у
36 баскетболистов высокого класса.
10. Достоверность различий
Следующим
важным вопросом практически для каждого
экспериментатора является умение
доказать достоверность различий между
двумя рядами признаков.
Проверку
достоверности различия двух рядов
измерений производят путем вычисления
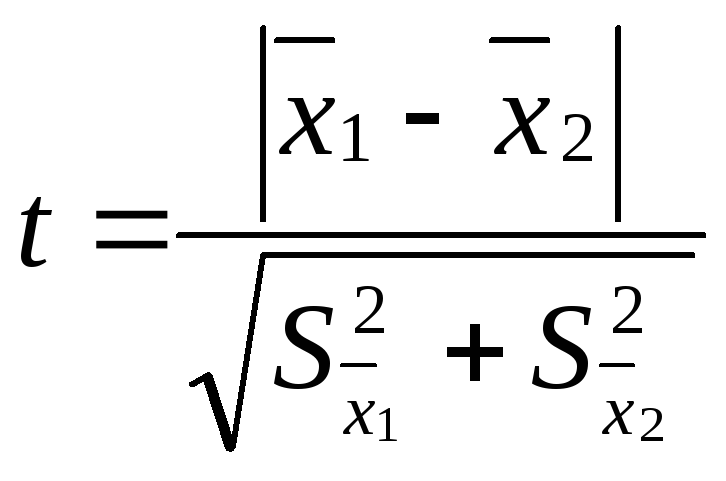
критерия достоверности различия – t:
 ,
,
где
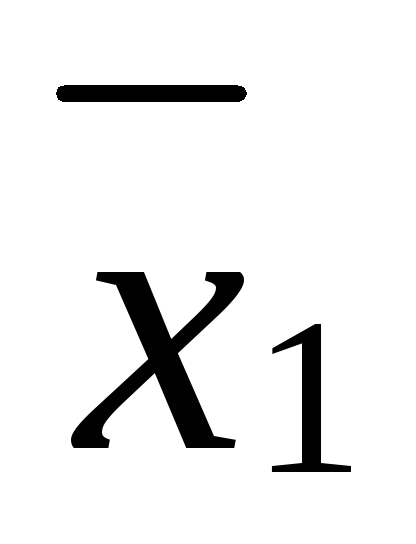 – средняя одной выборки;
 – средняя другой выборки;
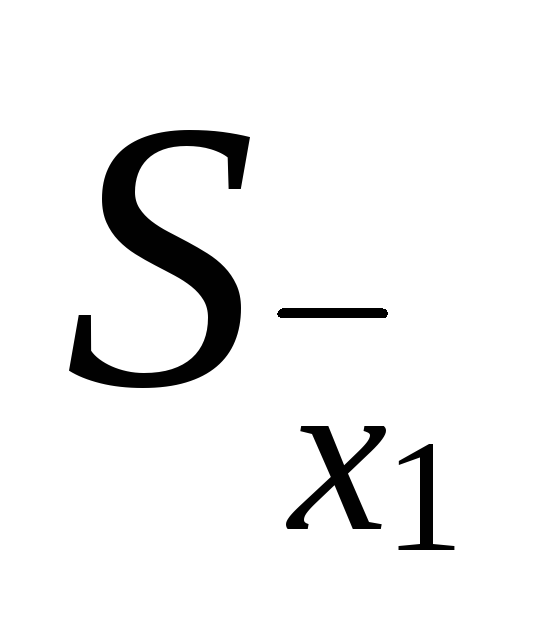 – средняя ошибка первой выборки;
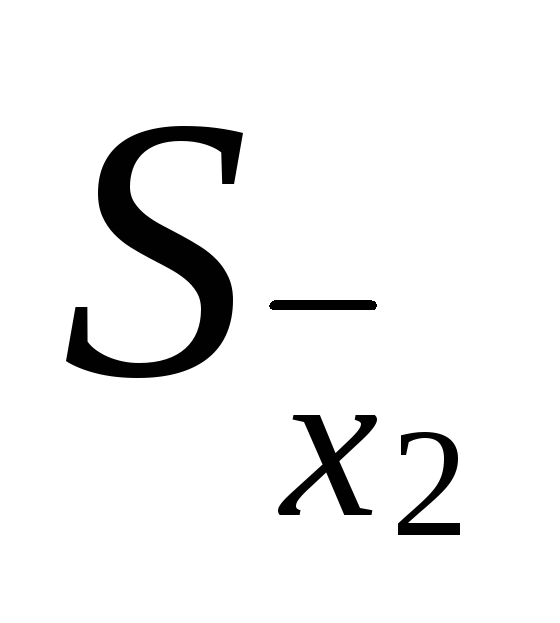 – второй выборки. Если t < 2, то различие
между двумя выборками считается
недостоверным, если t
2, то различие между двумя выборками
достоверно на 95%.
Соседние файлы в предмете [НЕСОРТИРОВАННОЕ]
- #
- #
- #
- #
- #
- #
- #
- #
- #
- #
- #

Download Article
Download Article
After collecting data, oftentimes the first thing you need to do is analyze it. This usually entails finding the mean, the standard deviation, and the standard error of the data. This article will show you how it’s done.
Cheat Sheets
-

1
Obtain a set of numbers you wish to analyze. This information is referred to as a sample.
- For example, a test was given to a class of 5 students, and the test results are 12, 55, 74, 79 and 90.
Advertisement
-

1
Calculate the mean. Add up all the numbers and divide by the population size:[1]
- Mean (μ) = ΣX/N, where Σ is the summation (addition) sign, xi is each individual number, and N is the population size.
- In the case above, the mean μ is simply (12+55+74+79+90)/5 = 62.
-

1
Calculate the standard deviation. This represents the spread of the population.
Standard deviation = σ = sq rt [(Σ((X-μ)^2))/(N)].[2]
- For the example given, the standard deviation is sqrt[((12-62)^2 + (55-62)^2 + (74-62)^2 + (79-62)^2 + (90-62)^2)/(5)] = 27.4. (Note that if this was the sample standard deviation, you would divide by n-1, the sample size minus 1.)
Advertisement
-

1
Calculate the standard error (of the mean). This represents how well the sample mean approximates the population mean. The larger the sample, the smaller the standard error, and the closer the sample mean approximates the population mean. Do this by dividing the standard deviation by the square root of N, the sample size.[3]
Standard error = σ/sqrt(n)[4]
- So for the example above, if this were a sampling of 5 students from a class of 50 and the 50 students had a standard deviation of 17 (σ = 21), the standard error = 17/sqrt(5) = 7.6.
Add New Question
-
Question
How do you find the mean given number of observations?

To find the mean, add all the numbers together and divide by how many numbers there are. e.g to find the mean of 1,7,8,4,2: 1+7+8+4+2 = 22/5 = 4.4.
-
Question
The standard error is calculated as 0.2 and the standard deviation of a sample is 5kg. Can it be said to be smaller or larger than the standard deviation?

The standard error (SE) must be smaller than the standard deviation (SD), because the SE is calculating by dividing the SD by something — i.e. making it smaller.
-
Question
How can I find out the standard deviation of 50 samples?

The results of all your figures (number plus number plus number etc.) divided by quantity of samples 50 =SD.
See more answers
Ask a Question
200 characters left
Include your email address to get a message when this question is answered.
Submit
Advertisement
Video
-
Calculations of the mean, standard deviation, and standard error are most useful for analysis of normally distributed data. One standard deviation about the central tendency covers approximately 68 percent of the data, 2 standard deviation 95 percent of the data, and 3 standard deviation 99.7 percent of the data. The standard error gets smaller (narrower spread) as the sample size increases.
Thanks for submitting a tip for review!
Advertisement
-
Check your math carefully. It is very easy to make mistakes or enter numbers incorrectly.
Advertisement
References
About This Article
Article SummaryX
The mean is simply the average of a set of numbers. You can work it out by adding up all the numbers and dividing the total by the amount of numbers. For example, if you wanted to find the average test score of 3 students who scored 74, 79, and 90, you’d add the 3 numbers together to get 243, then divide it by 3 to get 81. The standard error represents how well the sample mean approximates the population mean. All you need to do is divide the standard deviation by the square root of the sample size. For instance, if you were sampling 5 students from a class of 50 and the 50 students had a standard deviation of 17, you’d divide 17 by the square root of 5 to get 7.6. For more tips, including how to calculate the standard deviation, read on!
Did this summary help you?
Thanks to all authors for creating a page that has been read 995,237 times.
Did this article help you?
Download Article
Download Article
After collecting data, oftentimes the first thing you need to do is analyze it. This usually entails finding the mean, the standard deviation, and the standard error of the data. This article will show you how it’s done.
Cheat Sheets
-
1
Obtain a set of numbers you wish to analyze. This information is referred to as a sample.
- For example, a test was given to a class of 5 students, and the test results are 12, 55, 74, 79 and 90.
Advertisement
-
1
Calculate the mean. Add up all the numbers and divide by the population size:[1]
- Mean (μ) = ΣX/N, where Σ is the summation (addition) sign, xi is each individual number, and N is the population size.
- In the case above, the mean μ is simply (12+55+74+79+90)/5 = 62.
-
1
Calculate the standard deviation. This represents the spread of the population.
Standard deviation = σ = sq rt [(Σ((X-μ)^2))/(N)].[2]
- For the example given, the standard deviation is sqrt[((12-62)^2 + (55-62)^2 + (74-62)^2 + (79-62)^2 + (90-62)^2)/(5)] = 27.4. (Note that if this was the sample standard deviation, you would divide by n-1, the sample size minus 1.)
Advertisement
-
1
Calculate the standard error (of the mean). This represents how well the sample mean approximates the population mean. The larger the sample, the smaller the standard error, and the closer the sample mean approximates the population mean. Do this by dividing the standard deviation by the square root of N, the sample size.[3]
Standard error = σ/sqrt(n)[4]
- So for the example above, if this were a sampling of 5 students from a class of 50 and the 50 students had a standard deviation of 17 (σ = 21), the standard error = 17/sqrt(5) = 7.6.
Add New Question
-
Question
How do you find the mean given number of observations?
To find the mean, add all the numbers together and divide by how many numbers there are. e.g to find the mean of 1,7,8,4,2: 1+7+8+4+2 = 22/5 = 4.4.
-
Question
The standard error is calculated as 0.2 and the standard deviation of a sample is 5kg. Can it be said to be smaller or larger than the standard deviation?
The standard error (SE) must be smaller than the standard deviation (SD), because the SE is calculating by dividing the SD by something — i.e. making it smaller.
-
Question
How can I find out the standard deviation of 50 samples?
The results of all your figures (number plus number plus number etc.) divided by quantity of samples 50 =SD.
See more answers
Ask a Question
200 characters left
Include your email address to get a message when this question is answered.
Submit
Advertisement
Video
-
Calculations of the mean, standard deviation, and standard error are most useful for analysis of normally distributed data. One standard deviation about the central tendency covers approximately 68 percent of the data, 2 standard deviation 95 percent of the data, and 3 standard deviation 99.7 percent of the data. The standard error gets smaller (narrower spread) as the sample size increases.
Thanks for submitting a tip for review!
Advertisement
-
Check your math carefully. It is very easy to make mistakes or enter numbers incorrectly.
Advertisement
References
About This Article
Article SummaryX
The mean is simply the average of a set of numbers. You can work it out by adding up all the numbers and dividing the total by the amount of numbers. For example, if you wanted to find the average test score of 3 students who scored 74, 79, and 90, you’d add the 3 numbers together to get 243, then divide it by 3 to get 81. The standard error represents how well the sample mean approximates the population mean. All you need to do is divide the standard deviation by the square root of the sample size. For instance, if you were sampling 5 students from a class of 50 and the 50 students had a standard deviation of 17, you’d divide 17 by the square root of 5 to get 7.6. For more tips, including how to calculate the standard deviation, read on!
Did this summary help you?
Thanks to all authors for creating a page that has been read 995,237 times.