Модуль ngx_http_log_module записывает логи запросов
в указанном формате.
Логи записываются в контексте location’а, где заканчивается обработка.
Это может быть location, отличный от первоначального, если в процессе
обработки запроса происходит
внутреннее
перенаправление.
Пример конфигурации
log_format compression '$remote_addr - $remote_user [$time_local] '
                       '"$request" $status $bytes_sent '
                       '"$http_referer" "$http_user_agent" "$gzip_ratio"';

access_log /spool/logs/nginx-access.log compression buffer=32k;
Директивы
| Синтаксис: |
access_logaccess_log
|
|---|---|
| Умолчание: |
access_log logs/access.log combined; |
| Контекст: |
http, server, location, if в location, limit_except
|
Задаёт путь, формат и настройки буферизованной записи в лог.
На одном уровне конфигурации может использоваться несколько логов.
Запись в syslog
настраивается указанием префикса
“syslog:” в первом параметре.
Специальное значение off отменяет все директивы
access_log для текущего уровня.
Если формат не указан, то используется предопределённый формат
“combined”.
Если задан размер буфера с помощью параметра buffer или
указан параметр gzip (1.3.10, 1.2.7), то запись будет
буферизованной.
Размер буфера должен быть не больше размера атомарной записи в дисковый файл.
Для FreeBSD этот размер неограничен.
При включённой буферизации данные записываются в файл:
- если очередная строка лога не помещается в буфер;
-
если данные в буфере находятся дольше интервала времени, заданного
параметромflush(1.3.10, 1.2.7); -
при переоткрытии лог-файла или
завершении рабочего процесса.
Если задан параметр gzip, то буфер будет сжиматься перед
записью в файл.
Степень сжатия может быть задана в диапазоне от 1 (быстрее, но хуже сжатие)
до 9 (медленнее, но лучше сжатие).
По умолчанию используются буфер размером 64К байт и степень сжатия 1.
Данные сжимаются атомарными блоками, и в любой момент времени лог-файл может
быть распакован или прочитан с помощью утилиты “zcat”.
Пример:
access_log /path/to/log.gz combined gzip flush=5m;
Для поддержки gzip-сжатия логов nginx должен быть собран с библиотекой zlib.
В пути файла можно использовать переменные (0.7.6+),
но такие логи имеют некоторые ограничения:
-
пользователь,
с правами которого работают рабочие процессы, должен
иметь права на создание файлов в каталоге с такими логами; - не работает буферизация;
-
файл открывается для каждой записи в лог и сразу же после записи закрывается.
Следует однако иметь в виду, что поскольку дескрипторы часто используемых файлов
могут храниться в кэше,
то при вращении логов в течение времени, заданного параметром
validдирективы open_log_file_cache,
запись может продолжаться в старый файл. -
при каждой записи в лог проверяется существование
корневого каталога
для запроса — если этот каталог не существует, то лог не создаётся.
Поэтому root
иaccess_logнужно описывать на одном уровне конфигурации:server { root /spool/vhost/data/$host; access_log /spool/vhost/logs/$host; ...
Параметр if (1.7.0) включает условную запись в лог.
Запрос не будет записываться в лог, если результатом вычисления
условия является “0” или пустая строка.
В следующем примере запросы с кодами ответа 2xx и 3xx
не будут записываться в лог:
map $status $loggable {
    ~^[23]  0;
    default 1;
}

access_log /path/to/access.log combined if=$loggable;
| Синтаксис: |
log_format
|
|---|---|
| Умолчание: |
log_format combined "..."; |
| Контекст: |
http
|
Задаёт формат лога.
Параметр escape (1.11.8) позволяет задать
экранирование символов json или default
в переменных, по умолчанию используется default.
Значение none (1.13.10) отключает
экранирование символов.
При использовании default
символы “"”, “”,
a также символы со значениями меньше 32 (0.7.0) или больше 126 (1.1.6)
экранируются как “xXX”.
Если значение переменной не найдено,
то в качестве значения в лог будет записываться дефис (“-”).
При использовании json
экранируются все символы, недопустимые
в JSON строках:
символы “"” и
“” экранируются как
“"” и “\”,
символы со значениями меньше 32 экранируются как
“n”,
“r”,
“t”,
“b”,
“f” или
“u00XX”.
Кроме общих переменных в формате можно использовать переменные,
существующие только на момент записи в лог:
$bytes_sent- число байт, переданное клиенту
$connection- порядковый номер соединения
$connection_requests- текущее число запросов в соединении (1.1.18)
$msec- время в секундах с точностью до миллисекунд на момент записи в лог
$pipe-
“
p” если запрос был pipelined, иначе “.” $request_length- длина запроса (включая строку запроса, заголовок и тело запроса)
$request_time-
время обработки запроса в секундах с точностью до миллисекунд;
время, прошедшее с момента чтения первых байт от клиента до
момента записи в лог после отправки последних байт клиенту $status- статус ответа
$time_iso8601- локальное время в формате по стандарту ISO 8601
$time_local- локальное время в Common Log Format
В современных версиях nginx переменные
$status
(1.3.2, 1.2.2),
$bytes_sent
(1.3.8, 1.2.5),
$connection
(1.3.8, 1.2.5),
$connection_requests
(1.3.8, 1.2.5),
$msec
(1.3.9, 1.2.6),
$request_time
(1.3.9, 1.2.6),
$pipe
(1.3.12, 1.2.7),
$request_length
(1.3.12, 1.2.7),
$time_iso8601
(1.3.12, 1.2.7)
и
$time_local
(1.3.12, 1.2.7)
также доступны как общие переменные.
Строки заголовка, переданные клиенту, начинаются с префикса
“sent_http_”, например,
$sent_http_content_range.
В конфигурации всегда существует предопределённый формат
“combined”:
log_format combined '$remote_addr - $remote_user [$time_local] '
                    '"$request" $status $body_bytes_sent '
                    '"$http_referer" "$http_user_agent"';
| Синтаксис: |
open_log_file_cacheopen_log_file_cache
|
|---|---|
| Умолчание: |
open_log_file_cache off; |
| Контекст: |
http, server, location
|
Задаёт кэш, в котором хранятся дескрипторы файлов часто используемых
логов, имена которых заданы с использованием переменных.
Параметры директивы:
max-
задаёт максимальное число дескрипторов в кэше;
при переполнении кэша наименее востребованные (LRU)
дескрипторы закрываются inactive-
задаёт время, после которого закэшированный дескриптор закрывается,
если к нему не было обращений в течение этого времени;
по умолчанию 10 секунд min_uses-
задаёт минимальное число использований файла в течение
времени, заданного параметромinactive,
после которого дескриптор файла будет оставаться открытым в кэше;
по умолчанию 1 valid-
задаёт, через какое время нужно проверять, что файл ещё
существует под тем же именем;
по умолчанию 60 секунд off- запрещает кэш
Пример использования:
open_log_file_cache max=1000 inactive=20s valid=1m min_uses=2;
Nginx — это высокопроизводительный HTTP- сервер с открытым исходным кодом и обратный прокси-сервер, отвечающий за обработку нагрузки некоторых из крупнейших сайтов в Интернете. При управлении веб-серверами NGINX одной из наиболее частых задач, которые вы будете выполнять, является проверка файлов журналов.
Знание того, как настраивать и читать журналы, очень полезно при устранении неполадок сервера или приложений, поскольку они предоставляют подробную информацию об отладке.
Nginx записывает свои события в журналы двух типов: журналы доступа и журналы ошибок. Журналы доступа записывают информацию о клиентских запросах, а журналы ошибок записывают информацию о проблемах сервера и приложений.
В этой статье рассказывается, как настроить и прочитать журналы доступа и ошибок Nginx.
Настройка журнала доступа
Каждый раз, когда клиентский запрос обрабатывается, Nginx генерирует новое событие в журнале доступа. Каждая запись события содержит отметку времени и включает различную информацию о клиенте и запрошенном ресурсе. Журналы доступа могут показать вам местоположение посетителей, страницу, которую они посещают, сколько времени они проводят на странице и многое другое.
Директива log_format позволяет вам определять формат регистрируемых сообщений. Директива access_log включает и устанавливает расположение файла журнала и используемый формат.
Самый простой синтаксис директивы access_log следующий:
access_log log_file log_format;
Где log_file — это полный путь к файлу журнала, а log_format — формат, используемый файлом журнала.
Журнал доступа можно включить в блоке http , server или location .
По умолчанию журнал доступа глобально включен в директиве http в основном файле конфигурации Nginx.
/etc/nginx/nginx.conf
http {
  ...
  access_log  /var/log/nginx/access.log;
  ...
}
Для удобства чтения рекомендуется создавать отдельный файл журнала доступа для каждого серверного блока. Директива access_log установленная в директиве server access_log директиву, установленную в директиве http (более высокого уровня).
/etc/nginx/conf.d/domain.com.conf
http {
  ...
  access_log  /var/log/nginx/access.log;
  ...

  server {
    server_name domain.com
    access_log  /var/log/nginx/domain.access.log;
    ...
  }
}
Если формат журнала не указан, Nginx использует предопределенный комбинированный формат, который выглядит следующим образом:
log_format combined '$remote_addr - $remote_user [$time_local] '
                    '"$request" $status $body_bytes_sent '
                    '"$http_referer" "$http_user_agent"';
Чтобы изменить формат ведения журнала, отмените настройку по умолчанию или определите новую. Например, чтобы определить новый формат ведения журнала с именем custom, который расширит комбинированный формат значением, показывающим заголовок X-Forwarded-For добавьте следующее определение в директиву http или server :
log_format  custom  '$remote_addr - $remote_user [$time_local] "$request" '
                    '$status $body_bytes_sent "$http_referer" '
                    '"$http_user_agent" "$http_x_forwarded_for"';
Чтобы использовать новый формат, укажите его имя после файла журнала, как показано ниже:
access_log /var/log/nginx/access.log custom;
Хотя журнал доступа предоставляет очень полезную информацию, он занимает дисковое пространство и может повлиять на производительность сервера. Если на вашем сервере мало ресурсов и у вас загруженный веб-сайт, вы можете отключить журнал доступа. Чтобы сделать это, установите значение access_log директиву off :
Настройка журнала ошибок
Nginx записывает сообщения об ошибках приложения и общих ошибках сервера в файл журнала ошибок. Если вы испытываете ошибки в своем веб-приложении, журнал ошибок — это первое место, с которого можно начать поиск и устранение неисправностей.
Директива error_log включает и устанавливает расположение и уровень серьезности журнала ошибок. Он имеет следующую форму и может быть установлен в блоке http , server или location :
error_log log_file log_level
Параметр log_level устанавливает уровень ведения журнала. Ниже перечислены уровни в порядке их серьезности (от низкого до высокого):
debug—debugсообщения.-
info— Информационные сообщения. -
notice— Уведомления. -
warn— Предупреждения. -
error— Ошибки при обработке запроса. -
crit— Критические проблемы. Требуется быстрое действие. -
alert— Оповещения. Действия должны быть предприняты немедленно. -
emerg— Чрезвычайная ситуация. Система находится в непригодном для использования состоянии.
Каждый уровень журнала включает в себя более высокие уровни. Например, если вы установите уровень журнала , чтобы warn , Nginx будет также регистрировать error , crit , alert и emerg сообщения.
Если параметр log_level не указан, по умолчанию используется error .
По умолчанию директива error_log определена в директиве http внутри основного файла nginx.conf:
/etc/nginx/nginx.conf
http {
  ...
  error_log  /var/log/nginx/error.log;
  ...
}
Как и в случае с журналами доступа, рекомендуется создать отдельный файл журнала ошибок для каждого блока сервера, который переопределяет настройку, унаследованную от более высоких уровней.
Например, чтобы настроить журнал ошибок domain.com на warn вы должны использовать:
http {
  ...
  error_log  /var/log/nginx/error.log;
  ...

  server {
    server_name domain.com
    error_log  /var/log/nginx/domain.error.log warn;
    ...
  }
}
Каждый раз, когда вы изменяете файл конфигурации, вам необходимо перезапустить службу Nginx, чтобы изменения вступили в силу.
Расположение файлов журнала
По умолчанию в большинстве дистрибутивов Linux, таких как Ubuntu , CentOS и Debian , журналы доступа и ошибок расположены в каталоге /var/log/nginx .
Чтение и понимание файлов журнала Nginx
Вы можете открывать и анализировать файлы журнала, используя стандартные команды, такие как cat , less , grep , cut , awk и т. Д.
Вот пример записи из файла журнала доступа, в котором используется стандартный формат журнала Nginx для объединения:
192.168.33.1 - - [15/Oct/2019:19:41:46 +0000] "GET / HTTP/1.1" 200 396 "-" "Mozilla/5.0 (X11; Linux x86_64) AppleWebKit/537.36 (KHTML, like Gecko) Chrome/77.0.3865.120 Safari/537.36"
Давайте разберемся, что означает каждое поле записи:
$remote_addr—192.168.33.1— IP-адрес клиента, выполняющего запрос.-
$remote_user—-— Пользователь,$remote_userаутентификацию по HTTP. Если имя пользователя не задано, в этом поле отображается-. -
[$time_local]—[15/Oct/2019:19:41:46 +0000]— Время на локальном сервере. -
"$request"—"GET / HTTP/1.1"— тип запроса, путь и протокол. -
$status—200— Код ответа сервера. -
$body_bytes_sent—396— Размер ответа сервера в байтах. -
"$http_referer"—"-"— URL перехода. -
"$http_user_agent"—Mozilla/5.0 ...— Пользовательский агент клиента (веб-браузер).
Используйте команду tail для просмотра файла журнала в режиме реального времени:
tail -f access.log Выводы
Файлы журналов содержат полезную информацию о проблемах с сервером и о том, как посетители взаимодействуют с вашим сайтом.
Nginx позволяет настроить журналы доступа и ошибок в соответствии с вашими потребностями.
Если у вас есть какие-либо вопросы или отзывы, не стесняйтесь оставлять комментарии.
In this tutorial, you will learn everything you need to know about logging in
NGINX and how it can help you troubleshoot and quickly resolve any problem you
may encounter on your web server. We will discuss where the logs are stored and
how to access them, how to customize their format, and how to centralize them in
one place with Syslog or a log management service.
Here’s an outline of what you will learn by following through with this tutorial:
- Where NGINX logs are stored and how to access them.
- How to customize the NGINX log format and storage location to fit your needs.
- How to utilize a structured format (such as JSON) for your NGINX logs.
- How to centralize NGINX logs through Syslog or a managed cloud-based service.
Prerequisites
To follow through with this tutorial, you need the following:
- A Linux server that includes a non-root user with
sudoprivileges. We tested
the commands shown in this guide on an Ubuntu 20.04 server. - The
NGINX web server installedand enabled on your server.
🔭 Want to centralize and monitor your NGINX logs?
Head over to Logtail and start ingesting your logs in 5 minutes.
Step 1 — Locating the NGINX log files
NGINX writes logs of all its events in two different log files:
- Access log: this file contains information about incoming requests and
user visits. - Error log: this file contains information about errors encountered while
processing requests, or other diagnostic messages about the web server.
The location of both log files is dependent on the host operating system of the
NGINX web server and the mode of installation. On most Linux distributions, both
files will be found in the /var/log/nginx/ directory as access.log and
error.log, respectively.
A typical access log entry might look like the one shown below. It describes an
HTTP GET request to the server for a favicon.ico file.
Output
217.138.222.101 - - [11/Feb/2022:13:22:11 +0000] "GET /favicon.ico HTTP/1.1" 404 3650 "http://135.181.110.245/" "Mozilla/5.0 (Windows NT 10.0; Win64; x64) AppleWebKit/537.36 (KHTML, like Gecko) Chrome/98.0.4758.87 Safari/537.36" "-"
Similarly, an error log entry might look like the one below, which was generated
due to the inability of the server to locate the favicon.ico file that was
requested above.
Output
2022/02/11 13:12:24 [error] 37839#37839: *7 open() "/usr/share/nginx/html/favicon.ico" failed (2: No such file or directory), client: 113.31.102.176, server: _, request: "GET /favicon.ico HTTP/1.1", host: "192.168.110.245:80"
In the next section, you’ll see how to view both NGINX log files from the
command line.
Step 2 — Viewing the NGINX log files
Examining the NGINX logs can be done in a variety of ways. One of the most
common methods involves using the tail command to view logs entries in
real-time:
sudo tail -f /var/log/nginx/access.log
You will observe the following output:
Output
107.189.10.196 - - [14/Feb/2022:03:48:55 +0000] "POST /HNAP1/ HTTP/1.1" 404 134 "-" "Mozila/5.0"
35.162.122.225 - - [14/Feb/2022:04:11:57 +0000] "GET /.env HTTP/1.1" 404 162 "-" "Mozilla/5.0 (Windows NT 10.0; Win64; x64; rv:58.0) Gecko/20100101 Firefox/58.0"
45.61.172.7 - - [14/Feb/2022:04:16:54 +0000] "GET /.env HTTP/1.1" 404 197 "-" "Mozilla/5.0 (X11; Linux x86_64) AppleWebKit/537.36 (KHTML, like Gecko) Chrome/81.0.4044.129 Safari/537.36"
45.61.172.7 - - [14/Feb/2022:04:16:55 +0000] "POST / HTTP/1.1" 405 568 "-" "Mozilla/5.0 (X11; Linux x86_64) AppleWebKit/537.36 (KHTML, like Gecko) Chrome/81.0.4044.129 Safari/537.36"
45.137.21.134 - - [14/Feb/2022:04:18:57 +0000] "GET /dispatch.asp HTTP/1.1" 404 134 "-" "Mozilla/5.0 (iPad; CPU OS 7_1_2 like Mac OS X; en-US) AppleWebKit/531.5.2 (KHTML, like Gecko) Version/4.0.5 Mobile/8B116 Safari/6531.5.2"
23.95.100.141 - - [14/Feb/2022:04:42:23 +0000] "HEAD / HTTP/1.0" 200 0 "-" "-"
217.138.222.101 - - [14/Feb/2022:07:38:40 +0000] "GET /icons/ubuntu-logo.png HTTP/1.1" 404 197 "http://168.119.119.25/" "Mozilla/5.0 (Windows NT 10.0; Win64; x64) AppleWebKit/537.36 (KHTML, like Gecko) Chrome/98.0.4758.87 Safari/537.36"
217.138.222.101 - - [14/Feb/2022:07:38:42 +0000] "GET /favicon.ico HTTP/1.1" 404 197 "http://168.119.119.25/" "Mozilla/5.0 (Windows NT 10.0; Win64; x64) AppleWebKit/537.36 (KHTML, like Gecko) Chrome/98.0.4758.87 Safari/537.36"
217.138.222.101 - - [14/Feb/2022:07:44:02 +0000] "GET / HTTP/1.1" 304 0 "-" "Mozilla/5.0 (Windows NT 10.0; Win64; x64) AppleWebKit/537.36 (KHTML, like Gecko) Chrome/98.0.4758.87 Safari/537.36"
217.138.222.101 - - [14/Feb/2022:07:44:02 +0000] "GET /icons/ubuntu-logo.png HTTP/1.1" 404 197 "http://168.119.119.25/" "Mozilla/5.0 (Windows NT 10.0; Win64; x64) AppleWebKit/537.36 (KHTML, like Gecko) Chrome/98.0.4758.87 Safari/537.36"
The tail command prints the last 10 lines from the selected file. The -f
option causes it to continue displaying subsequent lines that are added to the
file in real-time.
To examine the entire contents of an NGINX log file, you can use the cat
command or open it in your text editor:
sudo cat /var/log/nginx/error.log
If you want to filter the lines that contain a specific term, you can use the
grep command as shown below:
sudo grep "GET /favicon.ico" /var/log/nginx/access.log
The command above will print all the lines that contain GET /favicon.ico so we
can see how many requests were made for that resource.
Step 3 — Configuring NGINX access logs
The NGINX access log stores data about incoming client requests to the server
which is beneficial when deciphering what users are doing in the application,
and what resources are being requested. In this section, you will learn how to
configure what data is stored in the access log.
One thing to keep in mind while following through with the instructions below is
that you’ll need to restart the nginx service after modifying the config file
so that the changes can take effect.
sudo systemctl restart nginx
Enabling the access log
The NGINX access Log should be enabled by default. However, if this is not the
case, you can enable it manually in the Nginx configuration file
(/etc/nginx/nginx.conf) using the access_log directive within the http
block.
Output
http {
  access_log /var/log/nginx/access.log;
}
This directive is also applicable in the server and location configuration
blocks for a specific website:
Output
server {
   access_log /var/log/nginx/app1.access.log;

  location /app2 {
    access_log /var/log/nginx/app2.access.log;
  }
}
Disabling the access log
In cases where you’d like to disable the NGINX access log, you can use the
special off value:
You can also disable the access log on a virtual server or specific URIs by
editing its server or location block configuration in the
/etc/nginx/sites-available/ directory:
Output
server {
  listen 80;

  access_log off;

  location ~* .(woff|jpg|jpeg|png|gif|ico|css|js)$ {
    access_log off;
  }
}
Logging to multiple access log files
If you’d like to duplicate the access log entries in separate files, you can do
so by repeating the access_log directive in the main config file or in a
server block as shown below:
Output
access_log /var/log/nginx/access.log;
access_log /var/log/nginx/combined.log;
Don’t forget to restart the nginx service afterward:
sudo systemctl restart nginx
Explanation of the default access log format
The access log entries produced using the default configuration will look like
this:
Output
127.0.0.1 alice Alice [07/May/2021:10:44:53 +0200] "GET / HTTP/1.1" 200 396 "-" "Mozilla/5.0 (Windows NT 10.0; Win64; x64) AppleWebKit/537.36 (KHTML, like Gecko) Chrome/90.0.4531.93 Safari/537.36"
Here’s a breakdown of the log message above:
127.0.0.1: the IP address of the client that made the request.alice: remote log name (name used to log in a user).Alice: remote username (username of logged-in user).[07/May/2021:10:44:53 +0200]: date and time of the request."GET / HTTP/1.1": request method, path and protocol.200: the HTTP response code.396: the size of the response in bytes."-": the IP address of the referrer (-is used when the it is not
available)."Mozilla/5.0 (Windows NT 10.0; Win64; x64) AppleWebKit/537.36 (KHTML, like Gecko) Chrome/90.0.4531.93 Safari/537.36"—
detailed user agent information.
Step 4 — Creating a custom log format
Customizing the format of the entries in the access log can be done using the
log_format directive, and it can be placed in the http, server or
location blocks as needed. Here’s an example of what it could look like:
Output
log_format custom '$remote_addr - $remote_user [$time_local] ' '"$request" $status $body_bytes_sent ' '"$http_referer" "$http_user_agent"';
This yields a log entry in the following format:
Output
217.138.222.109 - - [14/Feb/2022:10:38:35 +0000] "GET /favicon.ico HTTP/1.1" 404 197 "http://192.168.100.1/" "Mozilla/5.0 (Windows NT 10.0; Win64; x64) AppleWebKit/537.36 (KHTML, like Gecko) Chrome/98.0.4758.87 Safari/537.36"
The syntax for configuring an access log format is shown below. First, you need
to specify a nickname for the format that will be used as its identifier, and
then the log format string that represents the details and formatting for each
log message.
Output
log_format <nickname> '<formatting_variables>';
Here’s an explanation of each variable used in the custom log format shown
above:
$remote_addr: the IP address of the client$remote_user: information about the user making the request$time_local: the server’s date and time.$request: actual request details like path, method, and protocol.$status: the response code.$body_bytes_sent: the size of the response in bytes.$http_referer: the IP address of the HTTP referrer.$http_user_agent: detailed user agent information.
You may also use the following variables in your custom log format
(see here for the complete list
):
$upstream_connect_time: the time spent establishing a connection with an
upstream server.$upstream_header_time: the time between establishing a connection and
receiving the first byte of the response header from the upstream server.$upstream_response_time: the time between establishing a connection and
receiving the last byte of the response body from the upstream server.$request_time: the total time spent processing a request.$gzip_ratio: ration of gzip compression (if gzip is enabled).
After you create a custom log format, you can apply it to a log file by
providing a second parameter to the access_log directive:
Output
access_log /var/log/nginx/access.log custom;
You can use this feature to log different information in to separate log files.
Create the log formats first:
Output
log_format custom '$remote_addr - $remote_user [$time_local] ' '"$request" $status $body_bytes_sent ' '"$http_referer"';
log_format agent "$http_user_agent";
Then, apply them as shown below:
Output
access_log /var/log/nginx/access.log custom;
access_log /var/log/nginx/agent_access.log agent;
This configuration ensures that user agent information for all incoming requests
are logged into a separate access log file.
Step 5 — Formatting your access logs as JSON
A common way to customize NGINX access logs is to format them as JSON. This is
quite straightforward to achieve by combining the log_format directive with
the escape=json parameter introduced in Nginx 1.11.8 to escape characters that
are not valid in JSON:
Output
log_format custom_json escape=json
  '{'
    '"time_local":"$time_local",'
    '"remote_addr":"$remote_addr",'
    '"remote_user":"$remote_user",'
    '"request":"$request",'
    '"status": "$status",'
    '"body_bytes_sent":"$body_bytes_sent",'
    '"request_time":"$request_time",'
    '"http_referrer":"$http_referer",'
    '"http_user_agent":"$http_user_agent"'
  '}';
After applying the custom_json format to a log file and restarting the nginx
service, you will observe log entries in the following format:
{
  "time_local": "14/Feb/2022:11:25:44 +0000",
  "remote_addr": "217.138.222.109",
  "remote_user": "",
  "request": "GET /icons/ubuntu-logo.png HTTP/1.1",
  "status": "404",
  "body_bytes_sent": "197",
  "request_time": "0.000",
  "http_referrer": "http://192.168.100.1/",
  "http_user_agent": "Mozilla/5.0 (Windows NT 10.0; Win64; x64) AppleWebKit/537.36 (KHTML, like Gecko) Chrome/98.0.4758.87 Safari/537.36"
}
Step 6 — Configuring NGINX error logs
Whenever NGINX encounters an error, it stores the event data in the error log so
that it can be referred to later by a system administrator. This section will
describe how to enable and customize the error logs as you see fit.
Enabling the error log
The NGINX error log should be enabled by default. However, if this is not the
case, you can enable it manually in the relevant NGINX configuration file
(either at the http, server, or location levels) using the error_log
directive.
Output
error_log /var/log/nginx/error.log;
The error_log directive can take two parameters. The first one is the location
of the log file (as shown above), while the second one is optional and sets the
severity level of the log. Events with a lower severity level than set one will
not be logged.
Output
error_log /var/log/nginx/error.log info;
These are the possible levels of severity (from lowest to highest) and their
meaning:
debug: messages used for debugging.info: informational messages.notice: a notable event occurred.warn: something unexpected happened.error: something failed.crit: critical conditions.alert: errors that require immediate action.emerg: the system is unusable.
Disabling the error log
The NGINX error log can be disabled by setting the error_log directive to
off or by redirecting it to /dev/null:
Output
error_log off;
error_log /dev/null;
Logging errors into multiple files
As is the case with access logs, you can log errors into multiple files, and you
can use different severity levels too:
Output
error_log /var/log/nginx/error.log info;
error_log /var/log/nginx/emerg_error.log emerg;
This configuration will log every event except those at the debug level event
to the error.log file, while emergency events are placed in a separate
emerg_error.log file.
Step 7 — Sending NGINX logs to Syslog
Apart from logging to a file, it’s also possible to set up NGINX to transport
its logs to the syslog service especially if you’re already using it for other
system logs. Logging to syslog is done by specifying the syslog: prefix to
either the access_log or error_log directive:
Output
error_log  syslog:server=unix:/var/log/nginx.sock debug;
access_log syslog:server=[127.0.0.1]:1234,facility=local7,tag=nginx,severity=info;
Log messages are sent to a server which can be specified in terms of a domain
name, IPv4 or IPv6 address or a UNIX-domain socket path.
In the example above, error log messages are sent to a UNIX domain socket at the
debug logging level, while the access log is written to a syslog server with
an IPv4 address and port 1234. The facility= parameter specifies the type of
program that is logging the message, the tag= parameter applies a custom tag
to syslog messages, and the severity= parameter sets the severity level of
the syslog entry for access log messages.
For more information on using Syslog to manage your logs, you can check out our
tutorial on viewing and configuring system logs on
Linux.
Step 8 — Centralizing your NGINX logs
In this section, we’ll describe how you can centralize your NGINX logs in a log
management service through Vector
, a
high-performance tool for building observability pipelines. This is a crucial
step when administrating multiple servers so that you can monitor all your logs
in one place (you can also centralize your logs with an Rsyslog
server).
The following instructions assume that you’ve signed up for a free
Logtail account and retrieved your source
token. Go ahead and follow the relevant
installation instructions for Vector
for your operating system. For example, on Ubuntu, you may run the following
commands to install the Vector CLI:
curl -1sLf  'https://repositories.timber.io/public/vector/cfg/setup/bash.deb.sh'  | sudo -E bash
$ sudo apt install vector
After Vector is installed, confirm that it is up and running through
systemctl:
You should observe that it is active and running:
Output
● vector.service - Vector
     Loaded: loaded (/lib/systemd/system/vector.service; enabled; vendor preset: enabled)
     Active: active (running) since Tue 2022-02-08 10:52:59 UTC; 48s ago
       Docs: https://vector.dev
    Process: 18586 ExecStartPre=/usr/bin/vector validate (code=exited, status=0/SUCCESS)
   Main PID: 18599 (vector)
      Tasks: 3 (limit: 2275)
     Memory: 6.8M
     CGroup: /system.slice/vector.service
             └─18599 /usr/bin/vector
Otherwise, go ahead and start it with the command below.
sudo systemctl start vector
Afterward, change into a root shell and append your Logtail vector configuration
for NGINX into the /etc/vector/vector.toml file using the command below. Don’t
forget to replace the <your_logtail_source_token> placeholder below with your
source token.
sudo -s
$ wget -O ->> /etc/vector/vector.toml
    https://logtail.com/vector-toml/nginx/<your_logtail_source_token>
Then restart the vector service:
sudo systemctl restart vector
You will observe that your NGINX logs will start coming through in Logtail:
Conclusion
In this tutorial, you learned about the different types of logs that the NGINX
web server keeps, where you can find them, how to understand their formatting.
We also discussed how to create your own custom log formats (including a
structured JSON format), and how to log into multiple files at once. Finally, we
demonstrated the process of sending your logs to Syslog or a log management
service so that you can monitor them all in one place.
Thanks for reading, and happy logging!
Centralize all your logs into one place.
Analyze, correlate and filter logs with SQL.
Create actionable
dashboards.
Share and comment with built-in collaboration.
Got an article suggestion?
Let us know


Next article
How to Get Started with Logging in Node.js
Learn how to start logging with Node.js and go from basics to best practices in no time.
→

This work is licensed under a Creative Commons Attribution-NonCommercial-ShareAlike 4.0 International License.
I’m using Django with FastCGI + nginx. Where are the logs (errors) stored in this case?

asked Nov 10, 2009 at 7:09

Errors are stored in the nginx log file. You can specify it in the root of the nginx configuration file:
error_log /var/log/nginx/nginx_error.log warn;
On Mac OS X with Homebrew, the log file was found by default at the following location:
/usr/local/var/log/nginx
answered Nov 10, 2009 at 11:30

syavasyava
5,7481 gold badge16 silver badges2 bronze badges
3
I was looking for a different solution.
Error logs, by default, before any configuration is set, on my system (x86 Arch Linux), was found in:
/var/log/nginx/error.log
answered Sep 1, 2013 at 9:10

BenBen
53.4k48 gold badges176 silver badges223 bronze badges
2
You can use lsof (list of open files) in most cases to find open log files without knowing the configuration.
Example:
Find the PID of httpd (the same concept applies for nginx and other programs):
$ ps aux | grep httpd
...
root     17970  0.0  0.3 495964 64388 ?        Ssl  Oct29   3:45 /usr/sbin/httpd
...
Then search for open log files using lsof with the PID:
$ lsof -p 17970 | grep log
httpd   17970 root    2w   REG             253,15     2278      6723 /var/log/httpd/error_log
httpd   17970 root   12w   REG             253,15        0      1387 /var/log/httpd/access_log
If lsof prints nothing, even though you expected the log files to be found, issue the same command using sudo.
You can read a little more here.
answered Dec 10, 2014 at 16:06
5
Run this command, to check error logs:
tail -f /var/log/nginx/error.log

ndmeiri
4,92812 gold badges35 silver badges44 bronze badges
answered Oct 5, 2015 at 15:37

Taimoor ChangaizTaimoor Changaiz
9,9904 gold badges48 silver badges53 bronze badges
My ngninx logs are located here:
/usr/local/var/log/nginx/*
You can also check your nginx.conf to see if you have any directives dumping to custom log.
run nginx -t to locate your nginx.conf.
# in ngingx.conf
error_log  /usr/local/var/log/nginx/error.log;
error_log  /usr/local/var/log/nginx/error.log  notice;
error_log  /usr/local/var/log/nginx/error.log  info;
Nginx is usually set up in /usr/local or /etc/. The server could be configured to dump logs to /var/log as well.
If you have an alternate location for your nginx install and all else fails, you could use the find command to locate your file of choice.
find /usr/ -path "*/nginx/*" -type f -name '*.log', where /usr/ is the folder you wish to start searching from.
answered Dec 10, 2014 at 13:44

lfender6445lfender6445
32k11 gold badges117 silver badges98 bronze badges
1
Logs location on Linux servers:
Apache – /var/log/httpd/

IIS – C:inetpubwwwroot

Node.js – /var/log/nodejs/

nginx – /var/log/nginx/

Passenger – /var/app/support/logs/

Puma – /var/log/puma/

Python – /opt/python/log/

Tomcat – /var/log/tomcat8
answered Sep 6, 2018 at 12:34
Syed ShibliSyed Shibli
9721 gold badge12 silver badges15 bronze badges
Type this command in the terminal:
sudo cat /var/log/nginx/error.log
answered Jan 4, 2018 at 6:05

priyashapriyasha
4675 silver badges4 bronze badges
1
For Mac OS users, you can type nginx -help in your terminal.
nginx version: nginx/1.21.0
Usage: nginx [-?hvVtTq] [-s signal] [-p prefix]
             [-e filename] [-c filename] [-g directives]

Options:
  -?,-h         : this help
  -v            : show version and exit
  -V            : show version and configure options then exit
  -t            : test configuration and exit
  -T            : test configuration, dump it and exit
  -q            : suppress non-error messages during configuration testing
  -s signal     : send signal to a master process: stop, quit, reopen, reload
  -p prefix     : set prefix path (default: /opt/homebrew/Cellar/nginx/1.21.0/)
  -e filename   : set error log file (default: /opt/homebrew/var/log/nginx/error.log)
  -c filename   : set configuration file (default: /opt/homebrew/etc/nginx/nginx.conf)
  -g directives : set global directives out of configuration file
Then, you could find some default path for configuration and log files, in this case:
/opt/homebrew/log/nginx/error.log
answered Jun 26, 2021 at 3:48

minglyuminglyu
2,8352 gold badges12 silver badges31 bronze badges
cd /var/log/nginx/
cat error.log

answered Jun 9, 2015 at 6:12

0
It is a good practice to set where the access log should be in nginx configuring file . Using acces_log /path/ Like this.
keyval $remote_addr:$http_user_agent $seen zone=clients;

server { listen 443 ssl;

ssl_protocols TLSv1 TLSv1.1 TLSv1.2;
ssl_ciphers   HIGH:!aNULL:!MD5;

if ($seen = "") {
    set $seen  1;
    set $logme 1;
}
access_log  /tmp/sslparams.log sslparams if=$logme;
error_log  /pathtolog/error.log;
# ...
}
answered Jan 6, 2021 at 11:48

I found it in /usr/local/nginx/logs/*.
answered Jul 16, 2019 at 11:36

mygeeamygeea
4693 silver badges9 bronze badges
2
Файлы логов — первое место, где нужно искать ошибки. Особенно если это касается веб-сервера. В Nginx всего два основных лога: error_log и access_log.
Помогаем

Лог ошибок error_log
Логирование ошибок Nginx происходит в определенный файл, stderr или syslog. Он собирает все ошибки, которые произошли во время работы веб-сервера. По умолчанию он включен глобально:
error_log logs/error.log error;
Записываются только ошибки в файл по указанному пути
Для сбора только определенных ошибок необходимо разместить директиву в секции http, server, stream или location. А так можно логировать только критические ошибки и сигналы тревоги:
error_log logs/error.log warn;
Записываются ошибки уровня warn, error crit, alert, emerg
Дізнайтеся, як утримувати work-life-баланс, від топменеджерки з досвідом в NPR, Microsoft, IBM та Amazon Alexa.
РЕЄСТРУЙТЕСЯ!

Лог доступа access_log
Лог доступа Nginx по умолчанию размещен в директории logs/access.log. В него записываются данные о запросах пользователей, как только эти запросы обработаны. Для изменения директории расположения лога используется директива access_log:
access_log logs/access.log combined;
Используется комбинированный формат
В расширенном виде access_log можно настроить по своим требованиям:
http {

log_format compression '$remote_addr - $remote_user [$time_local] '
'"$request" $status $body_bytes_sent '
'"$http_referer" "$http_user_agent" "$gzip_ratio"';
server {
gzip on;
access_log /spool/logs/nginx-access.log compression;
...
}

}
Задается пользовательский формат с записью времени подключения, TTFB, TTLB, времени обработки запроса
Также можно исключить ненужную информацию из лога:
map $status $loggable {
~^[23] 0;
default 1;
}
access_log /path/to/access.log combined if=$loggable;
Исключает запросы к HTTP со статусом 2ХХ (успешно) и 3ХХ (редирект)
Запись в syslog
Стандартная для UNIX-систем утилита syslog может собирать логи и различные сообщения разных процессов на одном сервере:
access_log syslog:server=[2001:db8::1]:1234,facility=local7,tag=nginx,severity=info;
Перенаправляет информацию в syslog
Директива server указывает адрес сервера (здесь IPv6) и порт. А facility — специфические параметры программы: auth, authpriv, daemon, cron, ftp, lpr, kern, mail, news, syslog,user, uucp, local0 … local7.
Включение режима debug
При необходимости можно включить Nginx debug-режим записи логов, который обеспечивает расширенную информацию и полезен при решении серьезных проблем:
error_log logs/error.log debug;
Можно включить только для нужной секции или отдельных клиентов соединений
Этот текст был написан несколько лет назад. С тех пор упомянутые здесь инструменты и софт могли получить обновления. Пожалуйста, проверяйте их актуальность.
NGINX logging is often overlooked as a critical part of the web service and is commonly referenced only when an error occurs. But it’s important to understand from the beginning how to configure NGINX logs and what information is considered most important.
Within NGINX there are two types of logs available, the error log and the access log. How then would you configure the error and access logs and in what format should be used? Read on to learn all about how NGINX logging works!
Prerequisites
To follow along with this tutorial, it is necessary to have a recent working NGINX installation, ideally version 1.21.1 or higher. In this tutorial, Ubuntu is used to host the NGINX installation. To view formatted JSON log file output in the terminal you may want to install the jq utility
Learning the NGINX Logging System
The NGINX logging system has quite a few moving parts. Logging is made up of log formats (how logs are stored) and an NGNIX configuration file (nginx.conf) to enable and tune how logs are generated.
First, let’s cover the NGINX configuration file. An NGNIX configuration file defines a hierarchy of sections that are referred to as contexts within the NGINX documentation. These contexts are made up of a combination of the following, although not all available contexts are listed below.
- The “main” context is the root of the nginx.conf file
- The
httpcontext - Multiple
servercontexts - Multiple
locationcontexts
Inside one or more of these contexts is where you can define access_log and error_log configuration items, or directives. A logging directive defines how NGINX is supposed to record logs under each context.
NGINX Logs Logging Directive Structure
Logging directives are defined under each context with the log name, the location to store the log, and the level of log data to store.
<log name> <log location> <logging level>;- Log Location – You can store logs in three different areas; a file e.g.
/var/log/nginx/error.log, syslog e.g.syslog:server=unix:/var/log/nginx.sockor cyclic memory buffer e.g.memory:32m. - Logging Levels – The available levels are
debug,info,notice,warn,error,crit,alert, oremergwith the default beingerror. Thedebuglevel may not be available unless NGINX was compiled with the--with-debugflag.
Allowed Logging Directive Contexts
Both the error_log and access_log directives are allowed in only certain contexts. error_log is allowed in the main, http, mail, stream, server, and location contexts. While the access_log directive is allowed in http, server, location, if in location, and limit_exept contexts.
Logging directives override higher-up directives. For example, the
error_logdirective specified in alocationcontext will override the same directive specified in thehttpcontext.
You can see an example configuration below that contains various defined directives below.
# Log to a file on disk with all errors of the level warn and higher
error_log /var/log/nginx/error.log warn;

http {
  access_log /var/log/nginx/access.log combined;

  server {
		access_log /var/log/nginx/domain1.access.log combined;

		location {
			# Log to a local syslog server as a local7 facility, tagged as nginx, and with the level of notice and higher
		error_log syslog:server=unix:/var/log/nginx.sock,facility=local7,tag=nginx notice;
		}
  }

  server {
		access_log /var/log/nginx/domain2.access.log combined;

		location {
			# Log all info and higher error messages directly into memory, but max out at 32 Mb
			error_log memory:32m info;
		}
  }
}
Log Formats and the Access Log Directive
Beyond just NGINX error logs, each access request to NGINX is logged. An access request could be anything from requesting a web page to a specific image. As you might surmise, there is a lot of data that can be included in the logged requests.
To record general NGINX request activity, NGNIX relies on access logs using the access_log directive. Unlike the error_log directive which has a standard format, you can configure NGINX access logs to store in a particular format.
The Default access_log Log Format
NGNIX can record access log data in many different ways through log formats. By default, that log format is called combined. When you don’t specify a log format in the NGINX configuration file, NGNIX will log all requested according to the following schema.
'$remote_addr - $remote_user [$time_local] '
'"$request" $status $body_bytes_sent '
'"$http_referer" "$http_user_agent"'
Below, you can see an example of the combined format in practice.
127.0.0.1 - - [10/Oct/2020:15:10:20 -0600] "HEAD / HTTP/1.1" 200 0 "<https://example.com>" "Mozilla/5.0..."Defining Custom access_log Formats via log_format Directive
The default combined NGINX log format may work perfectly well for your needs, but what if you would like to add additional data, such as upstream service information, or use this in JSON format instead? You’ll need to define a custom log format using the log_format directive.
The log_format directive allows you to define multiple different access_log formats to be used across the various contexts in the configuration file.
An example of defining a log format is below which specifies many different fields and variables. This example defines a JSON logging format, you may choose to display various fields.
Check out all available variables via the NGINX documentation.
The json text displayed after the log_format directive is merely the name that is referenced by any access_log directive that wishes to use this format. By using log_format, multiple logging output formats may be defined and used by any combination of access_log directives throughout the NGINX configuration file.
log_format json escape=json '{ "time": "$time_iso8601", '
	'"remote_addr": "$remote_addr", '
	'"remote_user": "$remote_user", '
	'"ssl_protocol_cipher": "$ssl_protocol/$ssl_cipher", '
	'"body_bytes_sent": "$body_bytes_sent", '
	'"request_time": "$request_time", '
	'"status": "$status", '
	'"request": "$request", '
	'"request_method": "$request_method", '
	'"http_referrer": "$http_referer", '
	'"http_x_forwarded_for": "$http_x_forwarded_for", '
	'"http_cf_ray": "$http_cf_ray", '
	'"host": "$host", '
	'"server_name": "$server_name", '
	'"upstream_address": "$upstream_addr", '
	'"upstream_status": "$upstream_status", '
	'"upstream_response_time": "$upstream_response_time", '
	'"upstream_response_length": "$upstream_response_length", '
	'"upstream_cache_status": "$upstream_cache_status", '
	'"http_user_agent": "$http_user_agent" }';
The
log_formatmay only be used in thehttpcontext, but referenced by anyaccess_logdirective regardless of location.
Escaping Log Output
When you define log format via JSON, for example, you’ll sometimes need to escape variables defined in JSON to be treated as literal elements in the NGNIX configuration file. To do that, you can use various escape formats such as default, json, and none. If the escape command is omitted, the default format is used.
default– Double-quotes, “”, and all characters with ISO values less than 32 and greater than 126 will be escaped as “x##”. If no variable value is found, then a hyphen (-) will be logged.json– All disallowed characters in the JSON string format will be escaped.none– All escaping of values is disabled.
You’ll see a great example of NGNIX escaping all JSON variables in the example above using the json escape format (escape=json).
Configuring access_log Directives
For NGNIX to become recording access activity using the fancy log format you defined earlier, you must enable it using the access_log directive
Once you’ve defined the log format, you must enable the log inside of the NGINX configuration file much like the error_log directive.
An example of a typical access_log directive is shown below where it sends access logs in the json log_format, as previously defined, and to a file (/var/log/nginx/access.log). Then the special off parameter disables access logging in a specific context where the directive is included.
access_log /var/log/nginx/domain.access.log json;
access_log off;
Perhaps you have defined an access_log for a domain. How would you go about seeing the output from the below directive?
access_log /var/log/nginx/domain.access.log json;To demonstrate NGINX sending log output as defined by the access_log directive, first run the Linux cat command to grab the file contents and pipe the output to the tail command to show only a single line. Then finally, pass the single line to the jq utility to nicely format the JSON output.
cat /var/log/nginx/domain.access.log | tail -n 1 | jqLike the
error_log, both thememoryandsyslogformats work in addition to the standard file output.
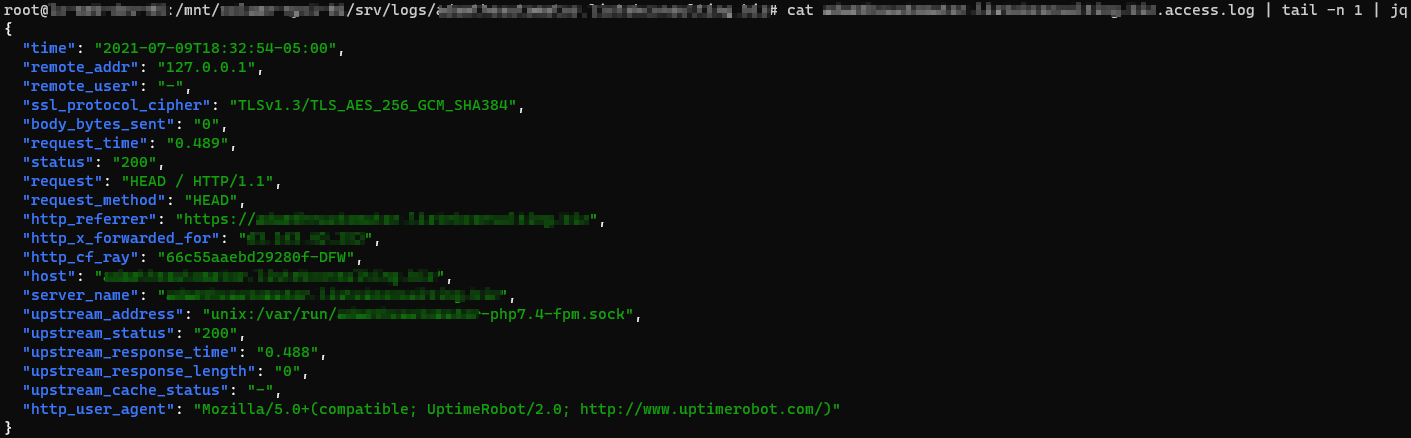
Configuring NGINX to Buffer Disk Writes
Since there is typically far more information output from access logging than error logging, additional abilities for compression and buffering of the log data to disk writes are included, but enabled by default. To avoid constant disk writes and potential request blocking of the webserver while waiting for disk IO, tell NGINX to buffer disk writes.
An example of an access_log directive defining the gzip, buffer, and flush parameters is shown below.
access_log /var/log/nginx/domain.access.log gzip=7 buffer=64k flush=3m;buffer– A buffer temporarily stores data, before sending it elsewhere. The default buffer size is64kwhich you can redefine by specifying a size along with the directive, i.e.buffer=32kinstead of justbuffer.gzip– Defines a level of GZIP compression to use from1to9, with 9 being the slowest but highest level of compression. For example,gzipdefaults to1but you will set (gzip=9) the compression to the highest.
If you use
gzipbut notbuffer, you’ll buffer the writes by default. Since the nature of GZIP compression means log entries cannot be streamed to disk, disk buffering is required.
flush– To avoid holding on to in-memory logs indefinitely for infrequently accessed sites, you’ll specify aflushtime to write any logging data to disk after that time threshold is met. For example, withflush=5myou force all logged data to be written to disk, even if the buffer has not filled.
Logging Access Entries Conditionally
There are times when you will only want to log a particular access request. For example, instead of logging all requests including HTTP/200 (successful requests), perhaps you’d like to only log HTTP/404 (file not found requests). If so, you can define a logging condition in the access_log directive using the if parameter.
The if= parameter of the access_log directive looks for values passed in by the associated variable that are not “0” or an empty string to continue with logging.
As an example, perhaps you’d like to force NGNIX to only log only HTTP access requests starting with a 4 for the HTTP code.
In the NGINX configuration file:
Define a map directive to assign a variable with the value of either 0 or 1 depending n the evaluated condition. The first regular expression looks for all HTTP statuses that do not start with 4. The default condition is the fallback for all values that do not meet that requirement.
map $status $logged {
    ~^[1235] 0;
    default  1;
}
The
mapdirective must be defined at thehttpcontext level. You may use themapdirective output variable, shown below as$logged, further in the configuration file and not confined to thehttpcontext level.
Once you have defined the map directive which will assign a value of 0 or 1 to the $logged variable, you can then use this variable in conditions as shown below. Here, using the if parameter, you’re telling NGINX to only log activity to the access_404.log file if it sees a request starting with 4.
access_log /var/log/nginx/access_404.log json if=$logged;Conclusion
Now that you know how to log errors and access requests in a variety of ways, you can start monitoring your NGINX installation for issues and also for user-facing problems.
What’s next? Try taking the results of the logs and ingesting those into a SIEM application for analysis!