Introduction
This document describes details surrounding Cyclic Redundancy Check (CRC) errors observed on interface counters and statistics of Cisco Nexus switches.
Prerequisites
Requirements
Cisco recommends that you understand the basics of Ethernet switching and the Cisco NX-OS Command Line Interface (CLI). For more information, refer to one of these applicable documents:
- Cisco Nexus 9000 NX-OS Fundamentals Configuration Guide, Release 10.2(x)
- Cisco Nexus 9000 Series NX-OS Fundamentals Configuration Guide, Release 9.3(x)
- Cisco Nexus 9000 Series NX-OS Fundamentals Configuration Guide, Release 9.2(x)
- Cisco Nexus 9000 Series NX-OS Fundamentals Configuration Guide, Release 7.x
- Troubleshooting Ethernet
Components Used
The information in this document is based on these software and hardware versions:
- Nexus 9000 series switches starting from NX-OS software release 9.3(8)
- Nexus 3000 series switches starting from NX-OS software release 9.3(8)
The information in this document was created from devices in a specific lab environment. All of the devices used in this document started with a cleared (default) configuration. If your network is live, ensure that you understand the potential impact of any command.
The information in this document was created from the devices in a specific lab environment. All of the devices used in this document started with a cleared (default) configuration. If your network is live, ensure that you understand the potential impact of any command.
Background Information
This document describes details surrounding Cyclic Redundancy Check (CRC) errors observed on interface counters on Cisco Nexus series switches. This document describes what a CRC is, how it is used in the Frame Check Sequence (FCS) field of Ethernet frames, how CRC errors manifest on Nexus switches, how CRC errors interact in Store-and-Forward switching and Cut-Through switching scenarios, the most likely root causes of CRC errors, and how to troubleshoot and resolve CRC errors.
Applicable Hardware
The information in this document is applicable to all Cisco Nexus Series switches. Some of the information in this document can also be applicable to other Cisco routing and switching platforms, such as Cisco Catalyst routers and switches.
CRC Definition
A CRC is an error detection mechanism commonly used in computer and storage networks to identify data changed or corrupted during transmission. When a device connected to the network needs to transmit data, the device runs a computation algorithm based on cyclic codes against the data that results in a fixed-length number. This fixed-length number is called the CRC value, but colloquially, it is often called the CRC for short. This CRC value is appended to the data and transmitted through the network towards another device. This remote device runs the same cyclic code algorithm against the data and compares the resulting value with the CRC appended to the data. If both values match, then the remote device assumes the data was transmitted across the network without being corrupted. If the values do not match, then the remote device assumes the data was corrupted during transmission across the network. This corrupted data cannot be trusted and is discarded.
CRCs are used for error detection across multiple computer networking technologies, such as Ethernet (both wired and wireless variants), Token Ring, Asynchronous Transfer Mode (ATM), and Frame Relay. Ethernet frames have a 32-bit Frame Check Sequence (FCS) field at the end of the frame (immediately after the payload of the frame) where a 32-bit CRC value is inserted.
For example, consider a scenario where two hosts named Host-A and Host-B are directly connected to each other through their Network Interface Cards (NICs). Host-A needs to send the sentence “This is an example” to Host-B over the network. Host-A crafts an Ethernet frame destined to Host-B with a payload of “This is an example” and calculates that the CRC value of the frame is a hexadecimal value of 0xABCD. Host-A inserts the CRC value of 0xABCD into the FCS field of the Ethernet frame, then transmits the Ethernet frame out of Host-A’s NIC towards Host-B.
When Host-B receives this frame, it will calculate the CRC value of the frame with the use of the exact same algorithm as Host-A. Host-B calculates that the CRC value of the frame is a hexadecimal value of 0xABCD, which indicates to Host-B that the Ethernet frame was not corrupted while the frame was transmitted to Host-B.
CRC Error Definition
A CRC error occurs when a device (either a network device or a host connected to the network) receives an Ethernet frame with a CRC value in the FCS field of the frame that does not match the CRC value calculated by the device for the frame.
This concept is best demonstrated through an example. Consider a scenario where two hosts named Host-A and Host-B are directly connected to each other through their Network Interface Cards (NICs). Host-A needs to send the sentence “This is an example” to Host-B over the network. Host-A crafts an Ethernet frame destined to Host-B with a payload of “This is an example” and calculates that the CRC value of the frame is the hexadecimal value 0xABCD. Host-A inserts the CRC value of 0xABCD into the FCS field of the Ethernet frame, then transmits the Ethernet frame out of Host-A’s NIC towards Host-B.
However, damage on the physical media connecting Host-A to Host-B corrupts the contents of the frame such that the sentence within the frame changes to “This was an example” instead of the desired payload of “This is an example”.
When Host-B receives this frame, it will calculate the CRC value of the frame including the corrupted payload. Host-B calculates that the CRC value of the frame is a hexadecimal value of 0xDEAD, which is different from the 0xABCD CRC value within the FCS field of the Ethernet frame. This difference in CRC values tells Host-B that the Ethernet frame was corrupted while the frame was transmitted to Host-B. As a result, Host-B cannot trust the contents of this Ethernet frame, so it will drop it. Host-B will usually increment some sort of error counter on its Network Interface Card (NIC) as well, such as the “input errors”, “CRC errors”, or “RX errors” counters.
Common Symptoms of CRC Errors
CRC errors typically manifest themselves in one of two ways:
- Incrementing or non-zero error counters on interfaces of network-connected devices.
- Packet/Frame loss for traffic traversing the network due to network-connected devices dropping corrupted frames.
These errors manifest themselves in slightly different ways depending on the device you are working with. These sub-sections go into detail for each type of device.
Received Errors on Windows Hosts
CRC errors on Windows hosts typically manifest as a non-zero Received Errors counter displayed in the output of the netstat -e command from the Command Prompt. An example of a non-zero Received Errors counter from the Command Prompt of a Windows host is here:
>netstat -e
Interface StatisticsReceived Sent
Bytes 1116139893 3374201234
Unicast packets 101276400 49751195
Non-unicast packets 0 0
Discards 0 0
Errors 47294 0
Unknown protocols 0
The NIC and its respective driver must support accounting of CRC errors received by the NIC in order for the number of Received Errors reported by the netstat -e command to be accurate. Most modern NICs and their respective drivers support accurate accounting of CRC errors received by the NIC.
RX Errors on Linux Hosts
CRC errors on Linux hosts typically manifest as a non-zero “RX errors” counter displayed in the output of the ifconfig command. An example of a non-zero RX errors counter from a Linux host is here:
$ ifconfig eth0
eth0: flags=4163<UP,BROADCAST,RUNNING,MULTICAST>  mtu 1500
        inet 192.0.2.10  netmask 255.255.255.128  broadcast 192.0.2.255
        inet6 fe80::10  prefixlen 64  scopeid 0x20<link>
        ether 08:62:66:be:48:9b  txqueuelen 1000  (Ethernet)
        RX packets 591511682  bytes 214790684016 (200.0 GiB)
        RX errors 478920  dropped 0  overruns 0  frame 0
        TX packets 85495109  bytes 288004112030 (268.2 GiB)
        TX errors 0  dropped 0 overruns 0  carrier 0  collisions 0
CRC errors on Linux hosts can also manifest as a non-zero “RX errors” counter displayed in the output of ip -s link show command. An example of a non-zero RX errors counter from a Linux host is here:
$ ip -s link show eth0
2: eth0: <BROADCAST,MULTICAST,UP,LOWER_UP> mtu 1500 qdisc mq state UP mode DEFAULT group default qlen 1000
    link/ether 08:62:66:84:8f:6d brd ff:ff:ff:ff:ff:ff
    RX: bytes  packets  errors  dropped overrun mcast
    32246366102 444908978 478920       647     0       419445867
    TX: bytes  packets  errors  dropped carrier collsns
    3352693923 30185715 0       0       0       0
    altname enp11s0
The NIC and its respective driver must support accounting of CRC errors received by the NIC in order for the number of RX Errors reported by the ifconfig or ip -s link show commands to be accurate. Most modern NICs and their respective drivers support accurate accounting of CRC errors received by the NIC.
CRC Errors on Network Devices
Network devices operate in one of two forwarding modes — Store-and-Forward forwarding mode, and Cut-Through forwarding mode. The way a network device handles a received CRC error differs depending on its forwarding modes. The subsections here will describe the specific behavior for each forwarding mode.
Input Errors on Store-and-Forward Network Devices
When a network device operating in a Store-and-Forward forwarding mode receives a frame, the network device will buffer the entire frame (“Store”) before you validate the frame’s CRC value, make a forwarding decision on the frame, and transmit the frame out of an interface (“Forward”). Therefore, when a network device operating in a Store-and-Forward forwarding mode receives a corrupted frame with an incorrect CRC value on a specific interface, it will drop the frame and increment the “Input Errors” counter on the interface.
In other words, corrupt Ethernet frames are not forwarded by network devices operating in a Store-and-Forward forwarding mode; they are dropped on ingress.
Cisco Nexus 7000 and 7700 Series switches operate in a Store-and-Forward forwarding mode. An example of a non-zero Input Errors counter and a non-zero CRC/FCS counter from a Nexus 7000 or 7700 Series switch is here:
switch# show interface
<snip>
Ethernet1/1 is up
  RX
    241052345 unicast packets  5236252 multicast packets  5 broadcast packets
    245794858 input packets  17901276787 bytes
    0 jumbo packets  0 storm suppression packets
    0 runts  0 giants  579204 CRC/FCS  0 no buffer
    579204 input error  0 short frame  0 overrun   0 underrun  0 ignored
    0 watchdog  0 bad etype drop  0 bad proto drop  0 if down drop
    0 input with dribble  0 input discard
    0 Rx pause
CRC errors can also manifest themselves as a non-zero “FCS-Err” counter in the output of show interface counters errors. The «Rcv-Err» counter in the output of this command will also have a non-zero value, which is the sum of all input errors (CRC or otherwise) received by the interface. An example of this is shown here:
switch# show interface counters errors
<snip>
--------------------------------------------------------------------------------
Port          Align-Err    FCS-Err   Xmit-Err    Rcv-Err  UnderSize OutDiscards
--------------------------------------------------------------------------------
Eth1/1                0     579204          0     579204          0           0
Input and Output Errors on Cut-Through Network Devices
When a network device operating in a Cut-Through forwarding mode starts to receive a frame, the network device will make a forwarding decision on the frame’s header and begin transmitting the frame out of an interface as soon as it receives enough of the frame to make a valid forwarding decision. As frame and packet headers are at the beginning of the frame, this forwarding decision is usually made before the payload of the frame is received.
The FCS field of an Ethernet frame is at the end of the frame, immediately after the frame’s payload. Therefore, a network device operating in a Cut-Through forwarding mode will already have started transmitting the frame out of another interface by the time it can calculate the CRC of the frame. If the CRC calculated by the network device for the frame does not match the CRC value present in the FCS field, that means the network device forwarded a corrupted frame into the network. When this happens, the network device will increment two counters:
- The “Input Errors” counter on the interface where the corrupted frame was originally received.
- The “Output Errors” counter on all interfaces where the corrupted frame was transmitted. For unicast traffic, this will typically be a single interface – however, for broadcast, multicast, or unknown unicast traffic, this could be one or more interfaces.
An example of this is shown here, where the output of the show interface command indicates multiple corrupted frames were received on Ethernet1/1 of the network device and transmitted out of Ethernet1/2 due to the Cut-Through forwarding mode of the network device:
switch# show interface
<snip>
Ethernet1/1 is up
RX
46739903 unicast packets 29596632 multicast packets 0 broadcast packets
76336535 input packets 6743810714 bytes
15 jumbo packets 0 storm suppression bytes
0 runts 0 giants 47294 CRC 0 no buffer
47294 input error 0 short frame 0 overrun 0 underrun 0 ignored
0 watchdog 0 bad etype drop 0 bad proto drop 0 if down drop
0 input with dribble 0 input discard
0 Rx pauseEthernet1/2 is up
TX
46091721 unicast packets 2852390 multicast packets 102619 broadcast packets
49046730 output packets 3859955290 bytes
50230 jumbo packets
47294 output error 0 collision 0 deferred 0 late collision
0 lost carrier 0 no carrier 0 babble 0 output discard
0 Tx pause
CRC errors can also manifest themselves as a non-zero “FCS-Err” counter on the ingress interface and non-zero «Xmit-Err» counters on egress interfaces in the output of show interface counters errors. The «Rcv-Err» counter on the ingress interface in the output of this command will also have a non-zero value, which is the sum of all input errors (CRC or otherwise) received by the interface. An example of this is shown here:
switch# show interface counters errors
<snip>
--------------------------------------------------------------------------------
Port          Align-Err    FCS-Err   Xmit-Err    Rcv-Err  UnderSize OutDiscards
--------------------------------------------------------------------------------
Eth1/1                0      47294          0      47294          0           0
Eth1/2                0          0      47294          0          0           0
The network device will also modify the CRC value in the frame’s FCS field in a specific manner that signifies to upstream network devices that this frame is corrupt. This behavior is known as “stomping” the CRC. The precise manner in which the CRC is modified varies from one platform to another, but generally, it involves inverting the current CRC value present in the frame’s FCS field. An example of this is here:
Original CRC: 0xABCD (1010101111001101)
Stomped CRC:  0x5432 (0101010000110010)
As a result of this behavior, network devices operating in a Cut-Through forwarding mode can propagate a corrupt frame throughout a network. If a network consists of multiple network devices operating in a Cut-Through forwarding mode, a single corrupt frame can cause input error and output error counters to increment on multiple network devices within your network.
Trace and Isolate CRC Errors
The first step in order to identify and resolve the root cause of CRC errors is isolating the source of the CRC errors to a specific link between two devices within your network. One device connected to this link will have an interface output errors counter with a value of zero or is not incrementing, while the other device connected to this link will have a non-zero or incrementing interface input errors counter. This suggests that traffic egresses the interface of one device intact is corrupted at the time of the transmission to the remote device, and is counted as an input error by the ingress interface of the other device on the link.
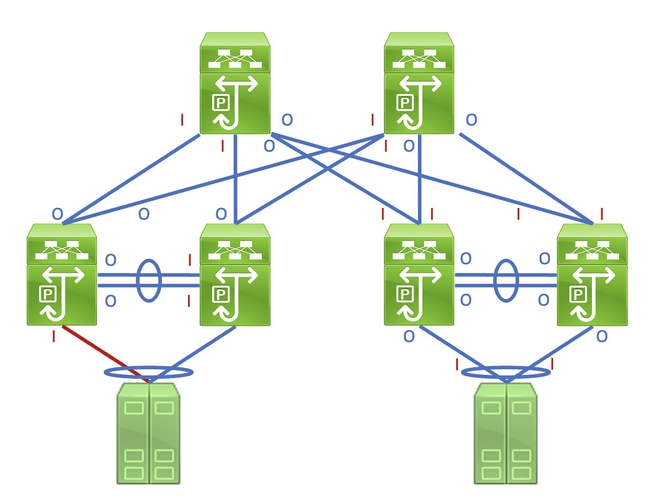
Identifying this link in a network consisting of network devices operating in a Store-and-Forward forwarding mode is a straightforward task. However, identifying this link in a network consisting of network devices operating in a Cut-Through forwarding mode is more difficult, as many network devices will have non-zero input and output error counters. An example of this phenomenon can be seen in the topology here, where the link highlighted in red is damaged such that traffic traversing the link is corrupted. Interfaces labeled with a red «I» indicate interfaces that could have non-zero input errors, while interfaces labeled with a blue «O» indicate interfaces that could have non-zero output errors.
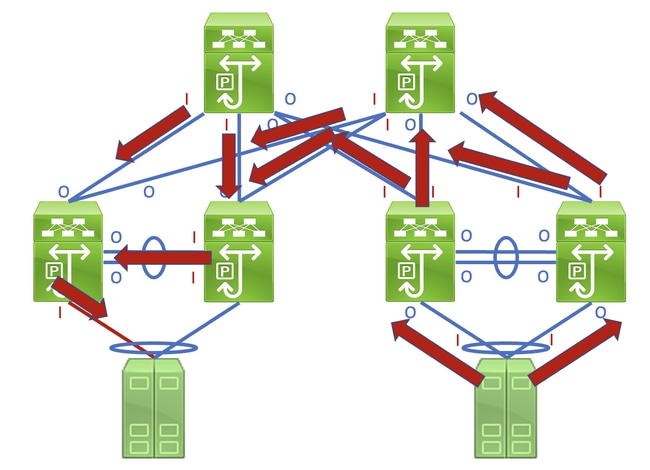
Identifying the faulty link requires you to recursively trace the «path» corrupted frames follow in the network through non-zero input and output error counters, with non-zero input errors pointing upstream towards the damaged link in the network. This is demonstrated in the diagram here.
A detailed process for tracing and identifying a damaged link is best demonstrated through an example. Consider the topology here:
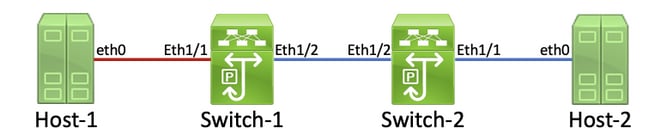
In this topology, interface Ethernet1/1 of a Nexus switch named Switch-1 is connected to a host named Host-1 through Host-1’s Network Interface Card (NIC) eth0. Interface Ethernet1/2 of Switch-1 is connected to a second Nexus switch, named Switch-2, through Switch-2’s interface Ethernet1/2. Interface Ethernet1/1 of Switch-2 is connected to a host named Host-2 through Host-2’s NIC eth0.
The link between Host-1 and Switch-1 through Switch-1’s Ethernet1/1 interface is damaged, causing traffic that traverses the link to be intermittently corrupted. However, we do not yet know that this link is damaged. We must trace the path the corrupted frames leave in the network through non-zero or incrementing input and output error counters to locate the damaged link in this network.
In this example, Host-2’s NIC reports that it is receiving CRC errors.
Host-2$ ip -s link show eth0
2: eth0: <BROADCAST,MULTICAST,UP,LOWER_UP> mtu 1500 qdisc mq state UP mode DEFAULT group default qlen 1000
    link/ether 00:50:56:84:8f:6d brd ff:ff:ff:ff:ff:ff
    RX: bytes  packets  errors  dropped overrun mcast
    32246366102 444908978 478920       647     0       419445867
    TX: bytes  packets  errors  dropped carrier collsns
    3352693923 30185715 0       0       0       0
    altname enp11s0
You know that Host-2’s NIC connects to Switch-2 via interface Ethernet1/1. You can confirm that interface Ethernet1/1 has a non-zero output errors counter with the show interface command.
Switch-2# show interface
<snip>
Ethernet1/1 is up
admin state is up, Dedicated Interface
    RX
      30184570 unicast packets  872 multicast packets  273 broadcast packets
      30185715 input packets  3352693923 bytes
      0 jumbo packets  0 storm suppression bytes
      0 runts  0 giants 0 CRC  0 no buffer
      0 input error  0 short frame  0 overrun   0 underrun  0 ignored
      0 watchdog  0 bad etype drop  0 bad proto drop  0 if down drop
      0 input with dribble  0 input discard
      0 Rx pause
    TX
      444907944 unicast packets  932 multicast packets  102 broadcast packets
      444908978 output packets  32246366102 bytes
      0 jumbo packets
      478920 output error  0 collision  0 deferred  0 late collision
      0 lost carrier  0 no carrier  0 babble  0 output discard
      0 Tx pause
Since the output errors counter of interface Ethernet1/1 is non-zero, there is most likely another interface of Switch-2 that has a non-zero input errors counter. You can use the show interface counters errors non-zero command in order to identify if any interfaces of Switch-2 have a non-zero input errors counter.
Switch-2# show interface counters errors non-zero
<snip>
--------------------------------------------------------------------------------
Port          Align-Err    FCS-Err   Xmit-Err    Rcv-Err  UnderSize OutDiscards
--------------------------------------------------------------------------------
Eth1/1                0          0     478920          0          0           0
Eth1/2                0     478920          0     478920          0           0

--------------------------------------------------------------------------------
Port         Single-Col  Multi-Col   Late-Col  Exces-Col  Carri-Sen       Runts
--------------------------------------------------------------------------------

--------------------------------------------------------------------------------
Port          Giants SQETest-Err Deferred-Tx IntMacTx-Er IntMacRx-Er Symbol-Err
--------------------------------------------------------------------------------

--------------------------------------------------------------------------------
Port         InDiscards
--------------------------------------------------------------------------------
You can see that Ethernet1/2 of Switch-2 has a non-zero input errors counter. This suggests that Switch-2 receives corrupted traffic on this interface. You can confirm which device is connected to Ethernet1/2 of Switch-2 through the Cisco Discovery Protocol (CDP) or Link Local Discovery Protocol (LLDP) features. An example of this is shown here with the show cdp neighbors command.
Switch-2# show cdp neighbors
<snip>
    Capability Codes: R - Router, T - Trans-Bridge, B - Source-Route-Bridge
    S - Switch, H - Host, I - IGMP, r - Repeater,
    V - VoIP-Phone, D - Remotely-Managed-Device,
    s - Supports-STP-Dispute

Device-ID          Local Intrfce  Hldtme Capability  Platform      Port ID
Switch-1(FDO12345678)
                    Eth1/2         125    R S I s   N9K-C93180YC- Eth1/2
You now know that Switch-2 is receiving corrupted traffic on its Ethernet1/2 interface from Switch-1’s Ethernet1/2 interface, but you do not yet know whether the link between Switch-1’s Ethernet1/2 and Switch-2’s Ethernet1/2 is damaged and causes the corruption, or if Switch-1 is a cut-through switch forwarding corrupted traffic it receives. You must log into Switch-1 to verify this.
You can confirm Switch-1’s Ethernet1/2 interface has a non-zero output errors counter with the show interfaces command.
Switch-1# show interface
<snip>
Ethernet1/2 is up
admin state is up, Dedicated Interface
    RX
      30581666 unicast packets  178 multicast packets  931 broadcast packets
      30582775 input packets  3352693923 bytes
      0 jumbo packets  0 storm suppression bytes
      0 runts  0 giants 0 CRC  0 no buffer
      0 input error  0 short frame  0 overrun   0 underrun  0 ignored
      0 watchdog  0 bad etype drop  0 bad proto drop  0 if down drop
      0 input with dribble  0 input discard
      0 Rx pause
    TX
      454301132 unicast packets  734 multicast packets  72 broadcast packets
      454301938 output packets  32246366102 bytes
      0 jumbo packets
      478920 output error  0 collision  0 deferred  0 late collision
      0 lost carrier  0 no carrier  0 babble  0 output discard
      0 Tx pause
You can see that Ethernet1/2 of Switch-1 has a non-zero output errors counter. This suggests that the link between Switch-1’s Ethernet1/2 and Switch-2’s Ethernet1/2 is not damaged — instead, Switch-1 is a cut-through switch forwarding corrupted traffic it receives on some other interface. As previously demonstrated with Switch-2, you can use the show interface counters errors non-zero command in order to identify if any interfaces of Switch-1 have a non-zero input errors counter.
Switch-1# show interface counters errors non-zero
<snip>
--------------------------------------------------------------------------------
Port          Align-Err    FCS-Err   Xmit-Err    Rcv-Err  UnderSize OutDiscards
--------------------------------------------------------------------------------
Eth1/1                0     478920          0     478920          0           0
Eth1/2                0          0     478920          0          0           0

--------------------------------------------------------------------------------
Port         Single-Col  Multi-Col   Late-Col  Exces-Col  Carri-Sen       Runts
--------------------------------------------------------------------------------

--------------------------------------------------------------------------------
Port          Giants SQETest-Err Deferred-Tx IntMacTx-Er IntMacRx-Er Symbol-Err
--------------------------------------------------------------------------------

--------------------------------------------------------------------------------
Port         InDiscards
--------------------------------------------------------------------------------
You can see that Ethernet1/1 of Switch-1 has a non-zero input errors counter. This suggests that Switch-1 is receiving corrupted traffic on this interface. We know that this interface connects to Host-1’s eth0 NIC. We can review Host-1’s eth0 NIC interface statistics to confirm whether Host-1 sends corrupted frames out of this interface.
Host-1$ ip -s link show eth0
2: eth0: <BROADCAST,MULTICAST,UP,LOWER_UP> mtu 1500 qdisc mq state UP mode DEFAULT group default qlen 1000
    link/ether 00:50:56:84:8f:6d brd ff:ff:ff:ff:ff:ff
    RX: bytes  packets  errors  dropped overrun mcast
    73146816142 423112898 0       0     0       437368817
    TX: bytes  packets  errors  dropped carrier collsns
    3312398924 37942624 0       0       0       0
    altname enp11s0
The eth0 NIC statistics of Host-1 suggest the host is not transmitting corrupted traffic. This suggests that the link between Host-1’s eth0 and Switch-1’s Ethernet1/1 is damaged and is the source of this traffic corruption. Further troubleshooting will need to be performed on this link to identify the faulty component causing this corruption and replace it.
Root Causes of CRC Errors
The most common root cause of CRC errors is a damaged or malfunctioning component of a physical link between two devices. Examples include:
- Failing or damaged physical medium (copper or fiber) or Direct Attach Cables (DACs).
- Failing or damaged transceivers/optics.
- Failing or damaged patch panel ports.
- Faulty network device hardware (including specific ports, line card Application-Specific Integrated Circuits [ASICs], Media Access Controls [MACs], fabric modules, etc.),
- Malfunctioning network interface card inserted in a host.
It is also possible for one or more misconfigured devices to inadvertently causes CRC errors within a network. One example of this is a Maximum Transmission Unit (MTU) configuration mismatch between two or more devices within the network causing large packets to be incorrectly truncated. Identifying and resolving this configuration issue can correct CRC errors within a network as well.
Resolve CRC Errors
You can identify the specific malfunctioning component through a process of elimination:
- Replace the physical medium (either copper or fiber) or DAC with a known-good physical medium of the same type.
- Replace the transceiver inserted in one device’s interface with a known-good transceiver of the same model. If this does not resolve the CRC errors, replace the transceiver inserted in the other device’s interface with a known-good transceiver of the same model.
- If any patch panels are used as part of the damaged link, move the link to a known-good port on the patch panel. Alternatively, eliminate the patch panel as a potential root cause by connecting the link without using the patch panel if possible.
- Move the damaged link to a different, known-good port on each device. You will need to test multiple different ports to isolate a MAC, ASIC, or line card failure.
- If the damaged link involves a host, move the link to a different NIC on the host. Alternatively, connect the damaged link to a known-good host to isolate a failure of the host’s NIC.
If the malfunctioning component is a Cisco product (such as a Cisco network device or transceiver) that is covered by an active support contract, you can open a support case with Cisco TAC detailing your troubleshooting to have the malfunctioning component replaced through a Return Material Authorization (RMA).
Related Information
- Nexus 9000 Cloud Scale ASIC CRC Identification & Tracing Procedure
- Technical Support & Documentation — Cisco Systems
Introduction
In data communication, the receive end needs to detect whether any error occurs during data transmission. Common technologies for the error detection include parity check, checksum, and cyclic redundancy check (CRC). The transmit end calculates the verification code based on a certain algorithm and sends the verification code and message to the receive end. The receive end obtains the verification code from the received message based on the same algorithm and compares the verification code with the received verification code to determine whether the received message is correct.
That is, the CRC error packet statistics indicate the number of times the verification nodes obtained by the transmit and receive ends using the CRC mode do not match.
You can view the CRC error packet statistics in the output of the display interface command. Generally, CRC error packets indicate that service packets are lost on the link.
<HUAWEI> display interface 10ge 1/0/1
10GE1/0/1 current state : DOWN (ifindex: 36)
Line protocol current state : DOWN
Description:
Switch Port, PVID :    1, TPID : 8100(Hex), The Maximum Frame Length is 9216
Internet protocol processing : disabled
IP Sending Frames' Format is PKTFMT_ETHNT_2, Hardware address is 00a0-c945-6101
Port Mode:             AUTO,     Port Split/Aggregate:               -
Speed:                 AUTO,     Loopback:                        NONE
Duplex:                FULL,     Negotiation:                        -
Input Flow-control: DISABLE,     Output Flow-control:          DISABLE
Mdi:                      -,     Fec:                                -
Last physical up time   : -
Last physical down time : 2015-01-03 18:50:04
Current system time: 2015-01-03 23:09:54
Statistics last cleared:never
    Last 10 seconds input rate: 0 bits/sec, 0 packets/sec
    Last 10 seconds output rate: 0 bits/sec, 0 packets/sec
    Input peak rate 0 bits/sec, Record time: -
    Output peak rate 0 bits/sec, Record time: -
    Input :                  0 bytes,                  0 packets
    Output:                  0 bytes,                  0 packets
    Input:
      Unicast:                      0,   Multicast:                       0
      Broadcast:                    0,   Jumbo:                           0
      Discard:                      0,   Frames:                          0
      Pause:                        0

      Total Error:                  0
      CRC:                          0,   Giants:                          0
      Jabbers:                      0,   Fragments:                       0
      Runts:                        0,   DropEvents:                      0
      Alignments:                   0,   Symbols:                         0
      Ignoreds:                     0
  ---- More ----
Procedure for Handling CRC Error Packets
Save the results of each troubleshooting step. If the fault persists after following this procedure, Huawei will need these results for further troubleshooting.
- Check the configuration and status of the local and remote interfaces.
Run the display this interface command multiple times in the interface view to check the interface status, and check whether the discarded packet count and CRC error packet count at the physical layer keep increasing stably. The CRC error packets are usually caused by interference of network cables. If the error packet count keeps increasing, check the cable quality first. It is normal if a few CRC error packets are received. This is often caused by poor contact of network cables. In this case, remove and reinstall the cables.
Ensure that optical interfaces at both ends of a link work in the same auto-negotiation mode. If they work in non-auto-negotiation mode, ensure that the interfaces work at the same rate and in the same duplex mode.
- Run the display interface transceiver verbose command to check whether the wavelengths of the optical modules at both ends are the same and whether the optical module information, such as the power, is normal.
<HUAWEI> display interface transceiver verbose 10GE1/0/1 transceiver information: ------------------------------------------------------------------- Common information: Transceiver Type :10GBASE_SR Connector Type :LC Wavelength (nm) :850 Transfer Distance (m) :30(62.5um/125um OM1) 80(50um/125um OM2) 300(50um/125um OM3) 400(50um/125um OM4) Digital Diagnostic Monitoring :YES Vendor Name :JDSU Vendor Part Number :PLRXPLSCS4322N Ordering Name : ------------------------------------------------------------------- Manufacture information: Manu. Serial Number :CB45UF0V2 Manufacturing Date :2011-11-8 Vendor Name :JDSU ------------------------------------------------------------------- Alarm information: ------------------------------------------------------------------- ---- More ---- - Remove and reinstall the optical fibers and optical modules and check whether the fiber connectors are damaged or contaminated, to determine whether the CRC error packets are caused by poor contact.
It is recommended that idle fiber connectors be covered with dust-proof caps to keep the fiber connectors clean. An unclean fiber connector may degrade the quality of optical signals or even cause link failures or error codes on the link.
- Check whether the optical fiber length is within the allowed transmission distance range of the optical module. If the transmission distance between two optical modules exceeds the maximum distance they support, alarms on low optical power will be generated even if the optical modules have the same wavelength.
In the command output in step 2, the Transfer Distance field indicates the transmission distance supported the optical module. View this field to determine whether the optical fiber length is within the allowed transmission distance range of the optical module. For example, in the preceding command output, the transmission distance supported by the OM1 optical fiber is 30 m. If the actual transmission distance exceeds 30 m, use an optical fiber with a longer transmission distance.
- Check whether the optical modules of the local and remote interfaces match the optical fibers connected to them.
Multimode optical modules must be used with multimode optical fibers. Single-mode optical modules are generally used with single-mode optical fibers, and can also be used with multimode optical fibers. If a single-mode optical module is used with a single-mode optical fiber, the transmission distance is often longer than 10 km.
Generally, a single-mode optical fiber is yellow, and a multimode optical fiber is orange.
Generally, the handle of a multimode optical module is black and that of a single-mode optical module is blue. You can also view the label attached to an optical module to check whether it is a single-mode or multimode optical module. SM and MM indicate single-mode and multimode, respectively.
- Check whether the local and remote interfaces use optical modules of different types from different vendors.
If the optical modules have the same wavelength and the transmission distance between them is within the allowed range, but alarms on high or low optical power are still generated, the two optical modules may be from different vendors and of different types. Although they have same wavelength, their optical power specifications may be different due to different designs adopted by the vendors. This may also cause alarms on abnormal optical power. Replace the optical modules with optical modules of the same type certified for Huawei Ethernet switches.
>Лечиться путём reset system и настройкой с нуля.
Не обязательно ресетить весь коммутатор, можно счетчики на портах обнулить (clear counters ports <portlist>)
Но эта проблема аппаратная, программно её не исправишь.
Небольшая статистика, откуда на клиентских портах CRC Err:
1. Самое распространенное: аппаратное отключение от сети интернет на стороне клиента (выдергивание вилки из сетевой карты) — как следствие плохой контакт между вилкой 8р8с и розеткой сетевой карты. Патчкорды никто не использует, а жесткий кабель обжатый в вилку 8р8с со временем теряет контакт.
Лечится не ресетом коммутатора, а тупо вынуть вилку из сетевой и снова воткнуть. Иногда клиент так задрачивает вилку, что приходится ехать переобжимать.
2. неисправность сетевой карты.
3. На стороне коммутатора. Сырость, пыль, грязь. Отсутствие гибких патчкордов. Кабель обжатый «двустволкой» после небольших телодвижений контакт в разъеме 8р8с лучше не становиться.
4. неисправность порта после грозы. Либо залило коммутатор водой (было такое: пинги ходят, а на IPerf порт виснет намертво)
5. По кабелю. Скрутки, боченки кат3. Кабель алюминиевый и/или стальной. Запредельная длина (больше 100метров), Толщина жилы AWG26 вместо положенных AWG24.
Последний раз редактировалось pvl Пт авг 26, 2011 10:12, всего редактировалось 2 раз(а).
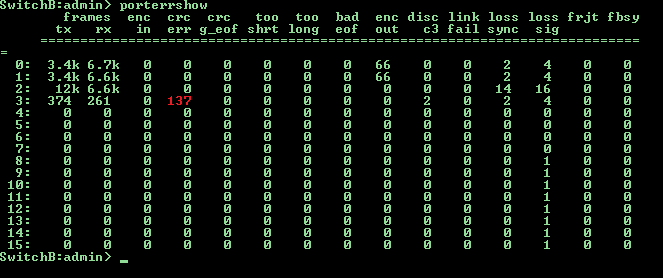
Нередко на сети хранения данных возникают такие неприятные вещи, как рост числа ошибок на портах и увеличение уровня затухания сигнала на sfp модулях. Принимая во внимание высокий уровень надежности SAN инфраструктуры, состоящей из двух и более фабрик, вероятность возникновения аварийной ситуации не так велика, но наложение негативных факторов может привести к потере данных или деградации производительности. К примеру, представьте себе ситуацию: на одной из фабрик проводится обновление FOS, все работает через вторую фабрику, а на ней между коммутатором к которому подключен дисковый массив и коммутатором к которому подключены серверы начинают быстро расти CRC ошибки на одном из транковых портов. Или еще хуже, пропадает линк из-за понижения уровня сигнала, вызванного повышением температуры SFP модуля, которая в свою очередь возросла из-за повысившейся утилизации данного канала. В таких случаях обычно говорят: «Ну кто же знал» или «100% надежных систем не бывает» и тд.
Грамотная архитектура + правильный мониторинг = отказоустойчивость
Итак проблема обозначена, необходимо разработать комплекс мер по повышению отказоустойчивости сети хранения данных, его можно разделить на два этапа:
- приведение архитектуры сети хранения данных в соответствие с «SAN best practices»
- развертывание системы мониторинга
Если про SAN best practices есть много литературы и курсов обучения, и можно пригласить крутых специалистов из интегратора для проведения экспертизы, то выбрать верный способ создать хорошую систему мониторинга SAN сети не так легко. Это можно объяснить жесткой привязкой: разработчик ПО — изготовитель коммутаторов. Я конечно не хочу сказать, что Cisco Fabric Manager или Brocade Network Advisor плохи, но они не позволяют делать все то, что необходимо на мой взгляд для повышения отказоустойчивости SAN сети.
Что делать
И так, задача поставлена, необходимо найти путь решения, часто это может осложняться отсутствием денег в бюджете на этот год, или неосведомленностью интегратора о существовании подходящего ПО, но это не проблема т.к. все необходимые компоненты есть в свободном доступе и требуется лишь заставить это все работать.
Разберем реализацию мониторинга CRC ошибок на портах SAN свичей brocade, большинство остальных параметров можно мониторить аналогичным образом.
Шаг первый, протокол сбора данных
Информацию о числе CRC ошибок можно получать с коммутаторов разными способами (snmp, https, telnet и ssh) мой выбор пал на последний т.к. telnet не безопасен и его лучше отключать, https сложен для извлечения конкретных значений, а snmp дерево может значительно меняться как на разных свичах, так и при переходе на новый FOS.
Шаг второй, метод сбора данных
Для работы с ssh лучше всего адаптирован linux в связке bash+expect, этим методом можно подключаться по ssh с диалоговым вводом команд.
Шаг третий, где хранить
Тут большой разницы нет, можно хранить хоть в текстовых файлах, но мы рассмотрим пример с mysql. Весь мониторинг реализован в двух скриптах:
porterrshow.sh — сбор информации и поиск инкремента значений CRC ошибок
expect.tcl — подключение по ssh
и трех txt файлах:
temp.txt — буфер данных
switches.txt — список san свичей в формате имя логин пароль на каждой строке
crc.txt — отчет о найденных CRC ошибках
Select запрос ищет инкремент роста CRC ошибок по сравнению с данными полученными один час назад, соответственно запуск скрипта необходимо производить один раз в час, причем начать и закончить свою работу скрипт должен в одном и том же часу. Данное ограничение можно легко обойти, если ввести поле порядкового номера запуска скрипта, либо потерять в производительности и задать более сложное условие выборки значений времени. На сервере должны быть установлены пакеты expect, mysql и ssh клиент. В базе данных dbname должен присутствовать пользователь user с правами на чтение и запись в таблицу tablename. В таблице tablename получаем данные аналогичные выводу команды porterrshow на свиче + дата и время.
porterrshow.sh
#!/bin/bash

rm /var/scripts/temp.txt        #Удаляем ранее созданный temp.txt
while read line                 #Читаем строку из файла switches.txt
do read sw user pass <<< $line  #Разбиваем строку на переменные

n=0                                                               #Обнуляем счетчик
while read line;                                                  #Читаем строку из вывода expect.tcl
do array[n]="$line"; n=$[n+1];                                    #Заполняем массив строками из вывода expect.tcl
done < <(/var/scripts/expect.tcl $sw $user $pass porterrshow)     #Отправляем данные в цикл

if echo ${array[4]} | grep -q '=';             #Проверяем с какой строки начинается вывод полезной информации
then k=5;
else k=4;
fi;

for i in `seq $k $[n-1]`;                                                                                                                            #В последней строке данных нет
do read a1 a2 a3 a4 a5 a6 a7 a8 a9 a10 a11 a12 a13 a14 a15 a16 a17 a18 a19 <<<  ${array[i]};      #Разбиваем строку на значения
(echo $sw,${a1%:},`date +%F`,`date +%T`,$a2,$a3,$a4,$a5,$a6,$a7,$a8,$a9,$a10,$a11,$a12,$a13,$a14,$a15,$a16,$a17) >> temp.txt		#Формируем подгрузочный файл
done;

done < /var/scripts/switches.txt          #Читаем файл со списком свичей

mysql -uuser -ppass dbname << EOF;
LOAD DATA LOCAL INFILE "temp.txt" INTO TABLE tablename FIELDS TERMINATED BY ',';
EOF
#Загружаем данные в БД

(mysql -uuser -ppass dbname << EOF
select new.switch, new.port, new.crcerr-old.crcerr from tablename new, tablename old where new.switch=old.switch and new.port=old.port and new.date=old.date and new.crcerr!=old.crcerr and new.crcerr!=0 and new.date=curdate() and hour(new.time)=hour(now()) and hour(old.time)=hour(now())-1;
EOF
) > /var/scripts/crc.txt           #Проверяем инкремент CRC по портам и пишем отчет в файл

if grep -q 'switch' /var/scripts/crc.txt
then
cat /var/scripts/crc.txt | mailx -r SAN_Switch_CRC_Tester -s "CRC errors is increased" sanadmin1@mywork.com
fi
#Отправляем информацию администратору
expect.tcl
#!/usr/bin/expect

#Устанавливаем таймаут соединения 10 сек
set timeout 10

#Проверям число параметров передаваемых скрипту
if {$argc != 4} {
    puts "Usage $argv0 host user pass command"
    exit 1}

#Назначаем параметры переменным
set host    [lindex $argv 0]
set user    [lindex $argv 1]
set pass    [lindex $argv 2]
set command [lindex $argv 3]

#Производим подключение по SSH
spawn ssh -oStrictHostKeyChecking=no -oCheckHostIP=no $user@$host $command
expect *assword:
send "$passr"
expect eof
Данный пост о том, что будет если сварка оптики проведена некачественно, а контрольные измерения сфальсифицированы.
У заказчика устанавливали новое сетевое оборудование HP для внутренней LAN. Коммутаторы HP 5412zl объединенные 10Гб/с линками. Оптика была заранее подготовлена другим подрядчиком. После монтажа и настройки коммутаторов и системы мониторинга в логах одного коммутатора стали сыпаться ошибки:
W 03/03/15 09:33:04 00329 FFI: AM1: port C3-Excessive CRC/alignment errors. See help.
W 03/03/15 09:34:05 00329 FFI: AM1: port C3-Excessive CRC/alignment errors. See help.
W 03/03/15 09:44:00 00329 FFI: AM1: port C3-Excessive CRC/alignment errors. See help.
W 03/03/15 09:53:54 00329 FFI: AM1: port C3-Excessive CRC/alignment errors. See help.
W 03/03/15 09:58:00 00329 FFI: AM1: port C3-Excessive CRC/alignment errors. See help.
W 03/03/15 10:01:25 00329 FFI: AM1: port C3-Excessive CRC/alignment errors. See help.
W 03/03/15 10:05:52 00329 FFI: AM1: port C3-Excessive CRC/alignment errors. See help.
W 03/03/15 10:08:36 00329 FFI: AM1: port C3-Excessive CRC/alignment errors. See help.
W 03/03/15 10:09:17 00329 FFI: AM1: port C3-Excessive CRC/alignment errors. See help.
W 03/03/15 10:11:00 00329 FFI: AM1: port C3-Excessive CRC/alignment errors. See help.
Что означает, что порт С3 отбрасывает кадры по причине неверной контрольной суммы.
Вот вывод статистики самого интерфейса:
# sh int c3
Status and Counters — Port Counters for port C3
Name : _______trk3_______
MAC Address : 2c59e5-aaabbb
Link Status : Up
Totals (Since boot or last clear) :
Bytes Rx : 250,722,825 Bytes Tx : 1,573,512,656
Unicast Rx : 322,901,717 Unicast Tx : 330,113,038
Bcast/Mcast Rx : 2,627,746 Bcast/Mcast Tx : 63,041,624
Errors (Since boot or last clear) :
FCS Rx : 1,198,124 Drops Tx : 0
Alignment Rx : 0 Collisions Tx : 0
Runts Rx : 0 Late Colln Tx : 0
Giants Rx : 16,231 Excessive Colln : 0
Total Rx Errors : 1,214,355 Deferred Tx : 0
Others (Since boot or last clear) :
Discard Rx : 0 Out Queue Len : 0
Unknown Protos : 0
Rates (5 minute weighted average) :
Total Rx (Kbps) : 50,000 Total Tx (Kbps) : 50,048
Unicast Rx (Pkts/sec) : 38 Unicast Tx (Pkts/sec) : 39
B/Mcast Rx (Pkts/sec) : 2 B/Mcast Tx (Pkts/sec) : 25
Utilization Rx : 00.50 % Utilization Tx : 00.50 %
Видно, что на 323 миллиона принятых кадров, 1.2 миллиона были отброшено. При том, что нормой считается 1 кадр на 5000, здесь явное превышение этого порога.
Так как порт оптический то возможно посмотреть данные о самом SFP трансивере:
# sh interfaces transceiver c3 de
Transceiver in C3
Interface Index : 51
Type : SFP+LR
Model : J9151A
Connector Type : LC
Wavelength : 1310nm
Transfer Distance : 10.0km (9um),
Diagnostic Support : DOM
Status
Temperature : 32.945C
Voltage : 3.3211V
Tx Bias : 40.554mA
Tx Power : 0.6202mW, -2.075dBm
Rx Power : 0.0111mW, -19.546dBm
Уровень получаемого сигнала слишком слаб (для SFP), что приводит к потерям при передаче. Причиной стало плохая пайка кабеля в кассете оптического кросса.
Решение — переход на другое волокно в этом кабеле.
Не всегда понятно что может означать та или иная ошибка при передаче. Ниже моя попытка объяснить значение счетчиков ошибок, которые регистрирует коммутатор.
Счетчики ошибок при получении кадров (RX):
CRC Error
Counts otherwise valid packets that did not end on a byte (octet) boundary.
Счетчик ошибок контрольной суммы (CRC). В свою очередь, является суммой счетчиков Alignment Errors и FCS Errors.
FCS (Frame Check Sequence) Errors — ошибки в контрольной последовательности кадра. Счетчик регистрирует кадры с ошибками FCS, при этом кадры имеют корректный размер (от 64 до 1518 байт) и получены без ошибок кадрирования или коллизий.
Alignment Errors — ошибки выравнивания (некорректной длины кадра). Счетчик регистрирует кадры с ошибками FCS, при этом кадры имеют корректный размер (от 64 до 1518 байт), но были получены с ошибками кадрирования.
В случае, если кадр был классифицирован как имеющий ошибку Alignment Error, счетчик FCS при этом не увеличивается. Иными словами, инкрементируется либо счетчик FCS либо Aligment, но не оба сразу.
UnderSize
The number of packets detected that are less than the minimum permitted packets size of 64
bytes and have a good CRC. Undersize packets usually indicate collision fragments, a normal
network occurrence.
Счетчик кадров с правильной контрольной суммой и размером менее 64 байт. Такие кадры могут возникать в результате коллизий в сети.
OverSize
Counts valid packets received that were longer than 1518 octets and less than the
MAX_PKT_LEN. Internally, MAX_PKT_LEN is equal to 1536.
Счетчик кадров с правильной контрольной суммой, размер которых превышает 1518 байт, но не превышает 1536 байт — внутреннего максимального значения кадра.
Fragment
The number of packets less than 64 bytes with either bad framing or an invalid CRC. These
are normally the result of collisions.
Счетчик кадров с неправильной контрольной суммой или структурой кадра и размером менее 64 байт. Такие кадры могут возникать в результате коллизий в сети.
Jabber
Counts invalid packets received that were longer than 1518 octets and less than the
MAX_PKT_LEN. Internally, MAX_PKT_LEN is equal to 1536.
Счетчик кадров с неправильной контрольной суммой, размер которых превышает 1518 байт, но не превышает 1536 байт — внутренного максимального значения кадра.
Счетчик ошибок при отправке кадров (TX):
Excessive Deferrral
Counts the number of packets for which the first transmission attempt on a particular
interface was delayed because the medium was busy.
Счетчик кадров, первая попытка отправки которых было отложена из-за занятости среды передачи.
CRC Error
Counts otherwise valid packets that did not end on a byte (octet) boundary.
Счетчик ошибок контрольной суммы (CRC).
На практике никогда не увеличивается.
Late Collision
Counts the number of times that a collision is detected later than 512 bit-times into the
transmission of a packet.
Счетчик случаев когда коллизия обнаруживалась после передачи первых 64 байт (512 бит) кадра.
Excessive Collision
Excessive Collisions. The number of packets for which transmission failed due to excessive
collisions.
Счетчик кадров, отправка которых не удалась из-за чрезмерного количества колизий.
Single Collision
Single Collision Frames. The number of successfully transmitted packets for which
transmission is inhibited by more than one collision.
Счетчик успешно отправленных кадров, передача которых вызвала более одной коллизии.
Collision
An estimate of the total number of collisions on this network segment.
Счетчик общего числа коллизий в сегменте сети.
Моно добавить, что на практике RX CRC обычно является результатом деградации среды передачи (медный кабель или оптоволокно), а TX-коллизии — результатом неправильного согласования скорости соединения, например half-линка.
Неплохая расшифровка значений счетчиков приведена тут.
Подскажите пожалуйста возможные причины сделующего:
Есть линк между dlink 3627g и catalist 3750-12s.
Расстояние по оптике 1.2 км. Трансиверы wdm 20км(noname)
Между точками имеется 2 волокна. Работа ведется по одному.
Три дня назад поперли RX ошибки на порту 3627.
Приехав на место(3627) обнаружили уровень сигнала -21 (замер сфп воткнутой в 3750 показал -5.7 )
Получается дикое затухание.
Перекидываемся на резервное волокно, таже картина.
Со места 3750 меряем трассу, картинка нормальная за исключением конца(для обоих волокон).
Идем и меряем трассу на месте 3627, трассы нет(для обоих волокон). Выкручиваем в кроссе пигтейл изнутри и вкручиваем заново в розетку(для обоих волокон).
После этой операции получаем уровень входного сиганала аж в районе -6 (по обеим волокнам).
После этого надеясь что проблема решена, узнаем что CRC ошибок по прежнему приличное количество(хотя заметно меньше чем раньше).
+ Менялись пачкорды, трансиверы и порты коммутаторов.
При этом проблема не решилась 🙁
Изменено 8 октября, 2011 пользователем Inp

RX (recive) — принимать пакеты приходящие от клиента
TX (transmit) передавать— пакеты приходящие к клиенту
Типы ошибок:
CRC Error — ошибки проверки контрольной суммы
Undersize — возникают при получение фрейма размером 61-64 байта.
Фрейм передается дальше, на работу не влияет
Oversize — возникают при получении пакета размером более 1518 байт и правильной контрольной суммой
Jabber — возникает при получении пакета размером более 1518 байт и имеющего ошибки в контрольной сумме
Drop Pkts — пакеты отброшенные в одном из трех случаев:
Какие пакеты входят в Drop Packets при выводе show error ports?
Переполнение входного буфера на порту
Пакеты, отброшенные ACL
Проверка по VLAN на входе
Fragment — количество принятых кадров длиной менее 64 байт (без преамбулы и начального ограничителя кадра, но включая байты FCS — контрольной суммы) и содержащих ошибки FCS или ошибки выравнивания.
Excessive Deferral — количество пакетов, первая попытка отправки которых была отложена по причине занятости среды передачи.
Collision — возникают, когда две станции одновременно пытаются передать кадр данных по общей сред
Late Collision — возникают, если коллизия была обнаружена после передачи первых 64 байт пакета
Excessive Collision — возникают, если после возникновения коллизии последующие 16 попыток передачи пакета окончались неудачей. данный пакет больше не передается
Single Collision — единичная коллизия
The counter is increasing because your frames are being corrupted.
CRC is a polynomial function on the frame which returns a 4B number in Ethernet. It will catch all single bit errors and a good percentage of double bit errors. It is thus meant to ensure that the frame was not corrupted in transit. If your CRC error counter is increasing it means that when your hardware ran the polynomial function on the frame, the result was a 4B number which differed from the 4B number found on the frame itself.
Ethernet frame CRC (FCS) is usually understood to be on OSI layer 2, many people claim it is layer 1 on Ethernet, but that is incorrect (only preamble, SFD and IFG are layer 1 on Ethernet).
I recommend a book called Computer Networks — A systems approach on this and many other subjects. It discusses CRC in-depth around page 92 through 102.
As Daniel pointed out, frames can get corrupted due to several reasons such as: duplex mismatch, faulty cabling and broken hardware. However, some level of CRC errors should be expected and the standard allows up-to 10-12 bit-error-rate on Ethernet (1 bit out of 1012 can flip) and it’s acceptable according to the standard.
In copper the signal travels by transferring state between electrons (electrons themselves are not traveling very much) and in fiber the signal travels by the photons reflecting off the walls of the fiber. There is a non-zero chance that the photon will simply change due to heat on the walls or the state of the electrons will flip itself. So even in perfect situations some errors will always happen. It should be known that a bit is not a single photon or single state change of an electron; today you need many photons or electron state changes to express a single bit, so a single incorrect ‘state’ will not yield an error as a bit is the average state of many of these.
The counter is increasing because your frames are being corrupted.
CRC is a polynomial function on the frame which returns a 4B number in Ethernet. It will catch all single bit errors and a good percentage of double bit errors. It is thus meant to ensure that the frame was not corrupted in transit. If your CRC error counter is increasing it means that when your hardware ran the polynomial function on the frame, the result was a 4B number which differed from the 4B number found on the frame itself.
Ethernet frame CRC (FCS) is usually understood to be on OSI layer 2, many people claim it is layer 1 on Ethernet, but that is incorrect (only preamble, SFD and IFG are layer 1 on Ethernet).
I recommend a book called Computer Networks — A systems approach on this and many other subjects. It discusses CRC in-depth around page 92 through 102.
As Daniel pointed out, frames can get corrupted due to several reasons such as: duplex mismatch, faulty cabling and broken hardware. However, some level of CRC errors should be expected and the standard allows up-to 10-12 bit-error-rate on Ethernet (1 bit out of 1012 can flip) and it’s acceptable according to the standard.
In copper the signal travels by transferring state between electrons (electrons themselves are not traveling very much) and in fiber the signal travels by the photons reflecting off the walls of the fiber. There is a non-zero chance that the photon will simply change due to heat on the walls or the state of the electrons will flip itself. So even in perfect situations some errors will always happen. It should be known that a bit is not a single photon or single state change of an electron; today you need many photons or electron state changes to express a single bit, so a single incorrect ‘state’ will not yield an error as a bit is the average state of many of these.